| Difficult | Execution Time | Data Analysis | Radioactive Sources |
|---|---|---|---|
| Yes | No |
Hardware setup
This experiment guide is referred to the SP5600EMU educational kit. If you don’t have this kit, choose your own from the following list to visualize the related experiment guide: SG6119E – Educational Kit.
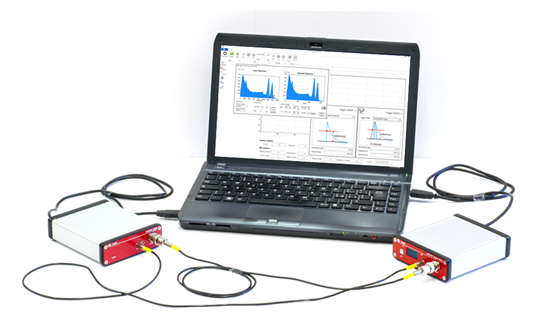
Equipment: SP5600EMU – Emulation Kit
| Model | DT4800 | DT5770 | Additional Tool |
|---|---|---|---|
| Description | Digital Detector Emulator | Digital Multi-Channel Analyzer | Additional Gamma Radioactive Source |
Purpose of the experiment
Determine the activity of a 60Co source from its gamma spectrum. Learn about the meaning of the sum peak, visible in the spectrum of some radioactive sources.
Fundamentals
The 60Co spectrum presents two distinct gamma photopeak in its spectrum, respectively corresponding to photons γ1 and γ2 at 1.17 MeV and 1.33 MeV. For the purpose of this experiment, we can assume that each of these gamma rays are isotropically distributed. In other words, if γ1 departs in a particular direction, γ2 can go in any direction that it wishes. There is a certain probability that γ2 will go in the same direction as γ1. If this occurs the energies of γ1 and γ2 will be summed in the detector. Hence a sum peak will show up in the spectrum, at nearly 2.5 MeV. We can estimate the activity of the source by calculating the counts under the two main peaks and under the sum peak, i.e. calculating their area ∑. For the case of 60Co, we have that the counts under the sum peak can be evaluated as: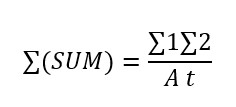
Where A is the activity of the source and t is the acquisition time. Therefore, fitting the peaks with a gaussian and calculating their area, it is possible to estimate the activity of the 60Co source used to record the available spectrum.
Carrying out the experiment
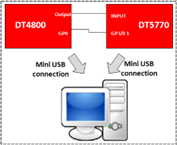
Experimental setup block diagram for the experiment.
To perform the experiment, connect the DT4800 output to the input channel of the MCA DT5770 and use the DT4800 GP0 as digitizer “trigger IN”. The Emulation Control Software Interface allows user to generate exponential decay signals with programmable rise time and fall time and it is possible to emulate signals from 60Co radioactive. The spectrum can be recorded and analyzed by the MCA.
Results
The student should verify that, after the spectrum calibration, the sum peak is nearly at 2.5 MeV. From the formula given above, using the live time in seconds, the student can estimate de activity of 60Co directly in Bq. A calculation made for a spectrum acquired in 100 seconds gives an activity of nearly 264 kBq.
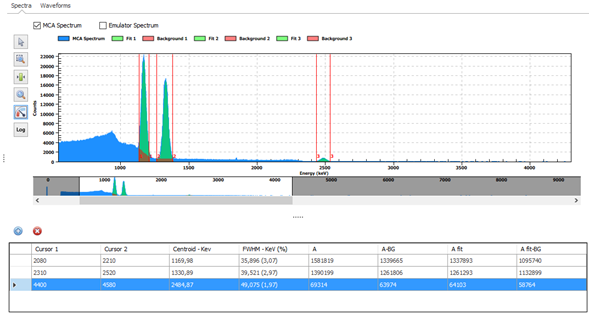
The 60Co complete spectrum acquired by the MCA DT5770 and plotted by the Emulation Software