| Difficult | Execution Time | Data Analysis | Radioactive Sources |
|---|---|---|---|
| Yes | No |
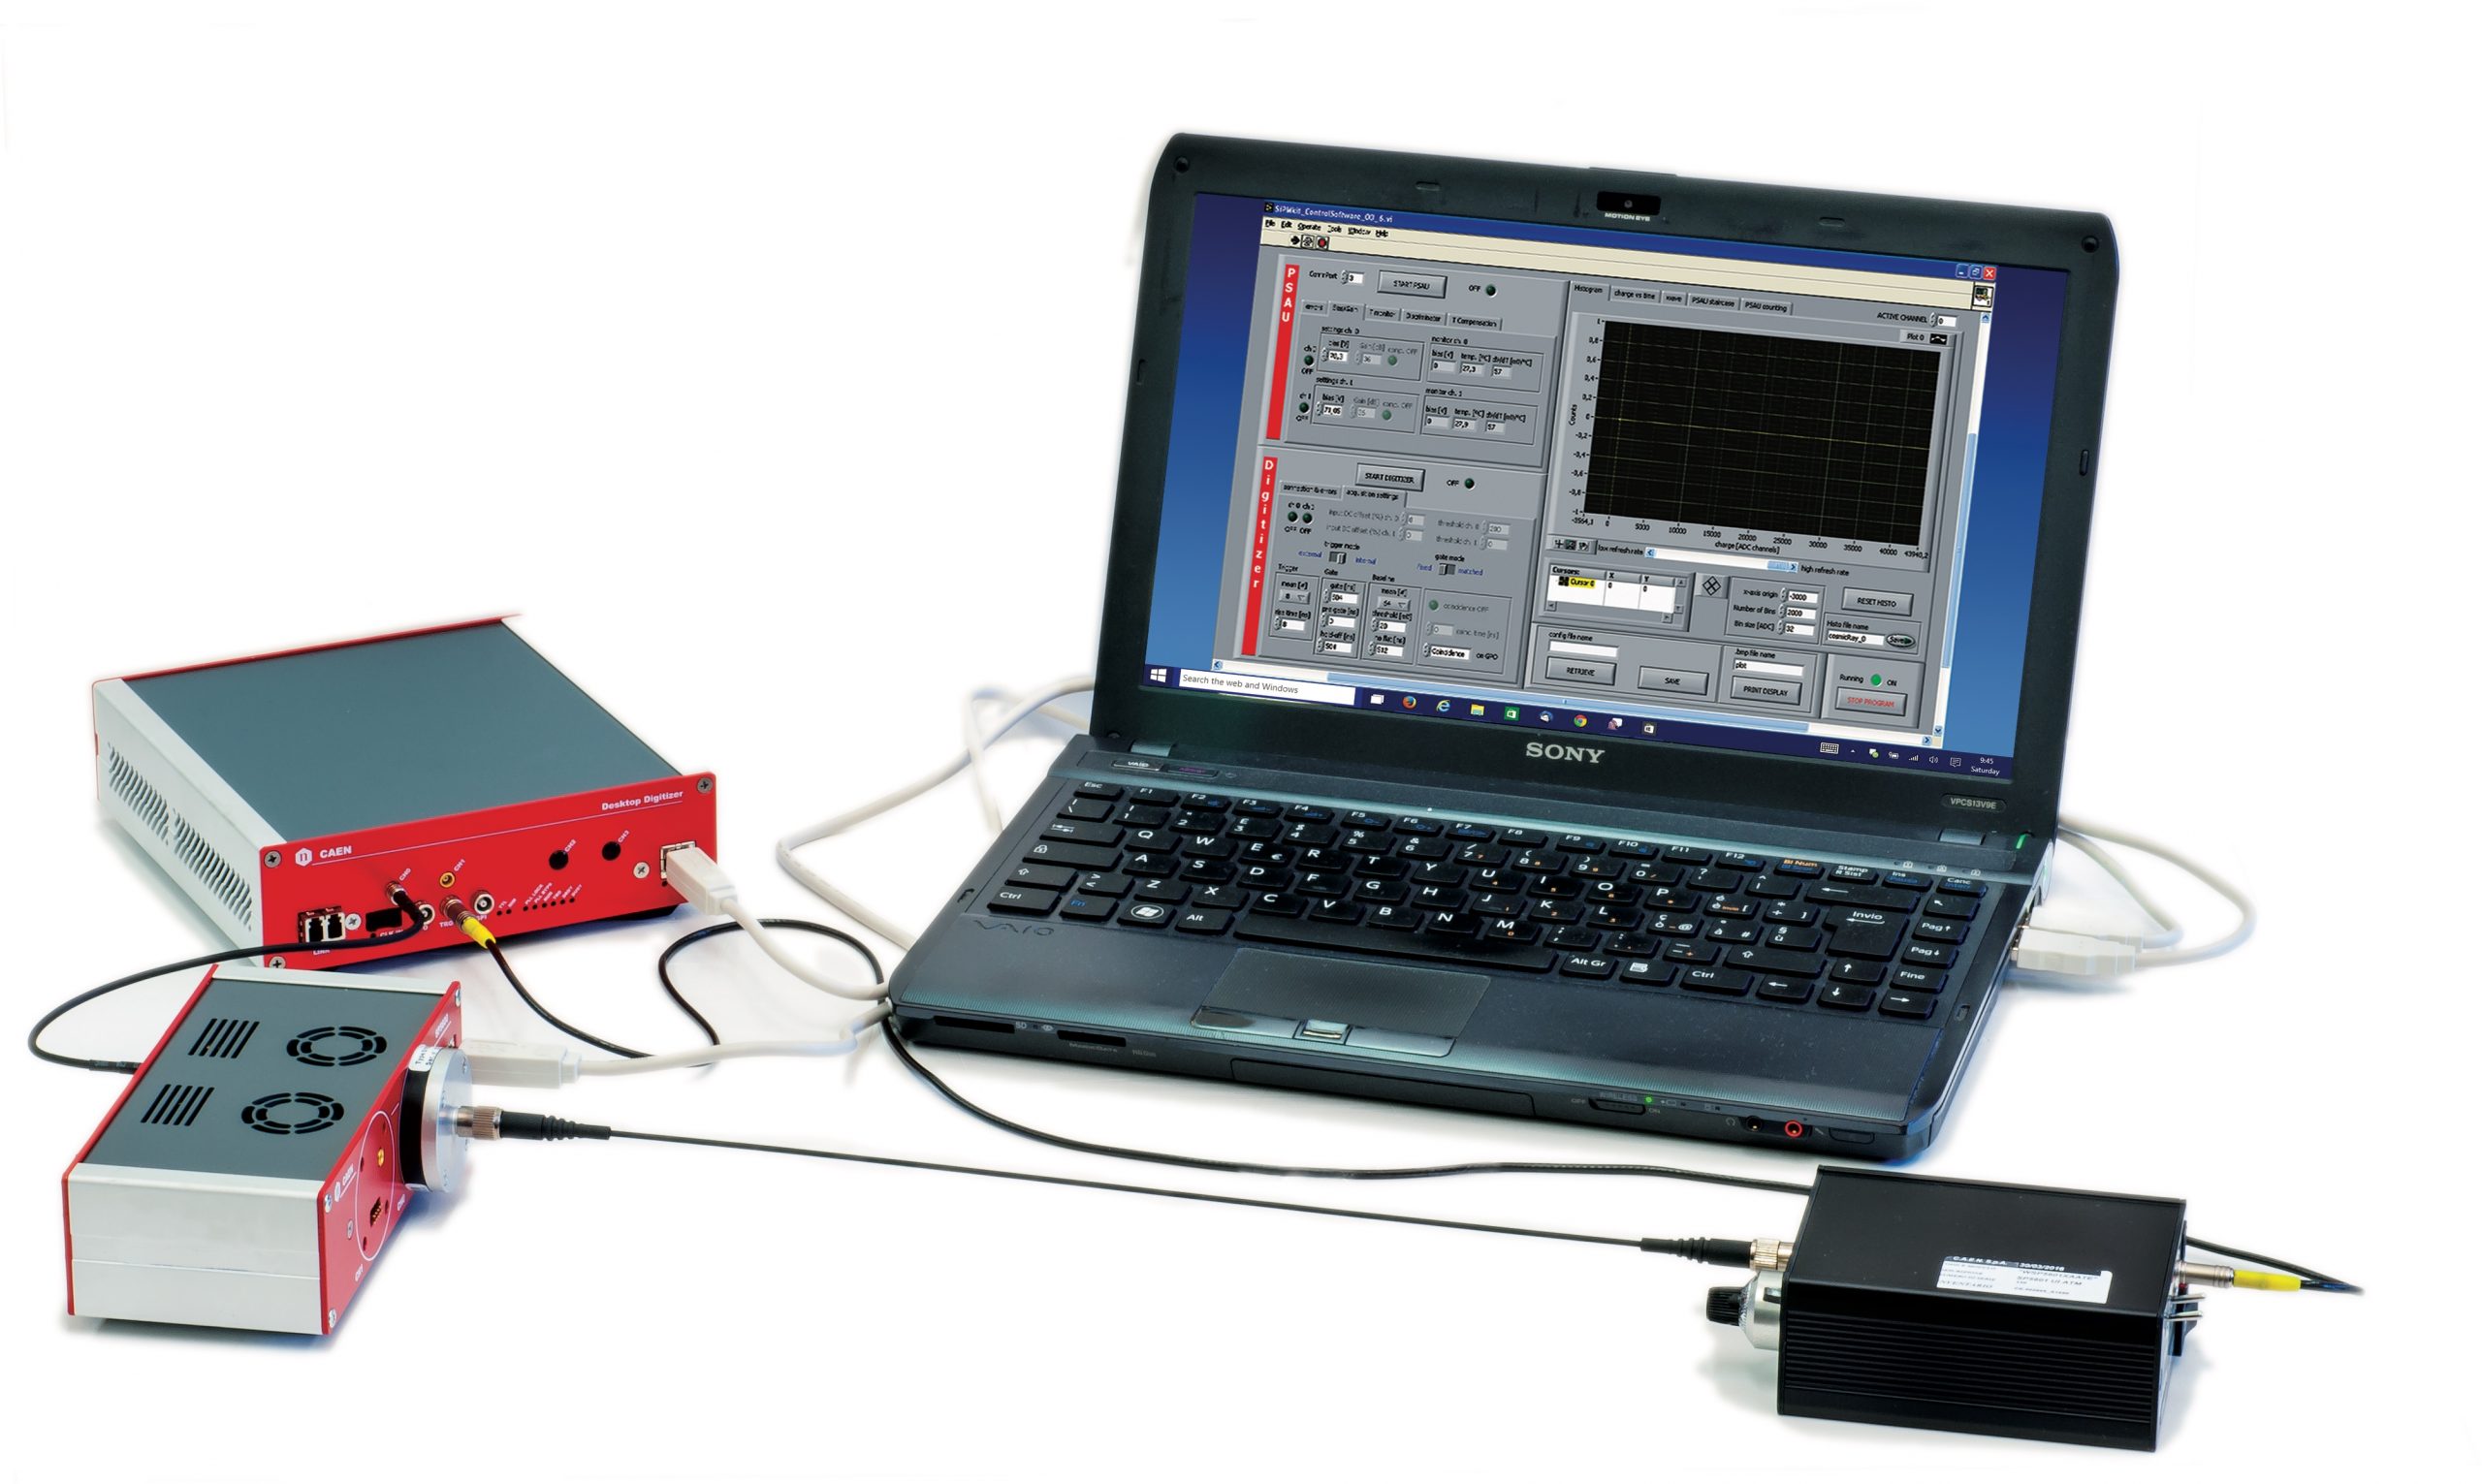
Hardware setup
This experiment guide is referred to the SP5600E/AN Educational Kit.
Equipment: SP5600E – Educational Photon Kit
| Model | SP5600 | DT5720A | SP5601 | SP5650C |
|---|---|---|---|---|
| Description | Power Supply and Amplification Unit | Desktop Digitizer 250 MS/s | LED Driver | Sensor Holder for SP5600 with SiPM |
Purpose of the experiment
Statistical properties of the light pulses emitted by a LED driver.
Fundamentals
Spontaneous emission of light results from random decays of excited atoms and it is expected to be Poissonian. SiPM can count the number of impacting photons, shot by shot, opening up the possibility to apply basic skills in probability and statistics while playing with light quanta displaying the spectrum of the SiPM response to a high statistics of pulses. The spectrum is composed by a series of peaks, each ones correspond to different number of cells fired at the same time. Each peak is well separated and occurs with a probability linked at first order to the light intensity fluctuations. In SiPM the homogeneity of the response is quite high, however, since fired cells are randomly distributed in the detector sensitive area residual differences in the gain become evident broadening the peak. A key point in the analysis technique was the estimation of the area underneath every peak, essential to reconstruct the probability density function of the emitted number of photons per pulse. An easy procedure is to consider each peak as a gaussian, so spectra recorded in response to photons impacting on the sensor can be seen as a superposition of Gaussians, each corresponding to a well defined number of fired cells. A binned Gaussian distribution of Npk events may be written as:![]()
where yi is the number of events in the bin centred on xi and ymax is the peak value, measured in x0. Since ymax = Npk/(σ√2π), knowing the content of the bin centred in x0 and estimating σ leads to Npk. The standard deviation can also be calculated in a simple way by the Full Width at Half Maximum (FWHM), obtained searching for the position of the bins with a content equals to ymax/2 presuming that FWHM = 2.355σ
Carrying out the experiment
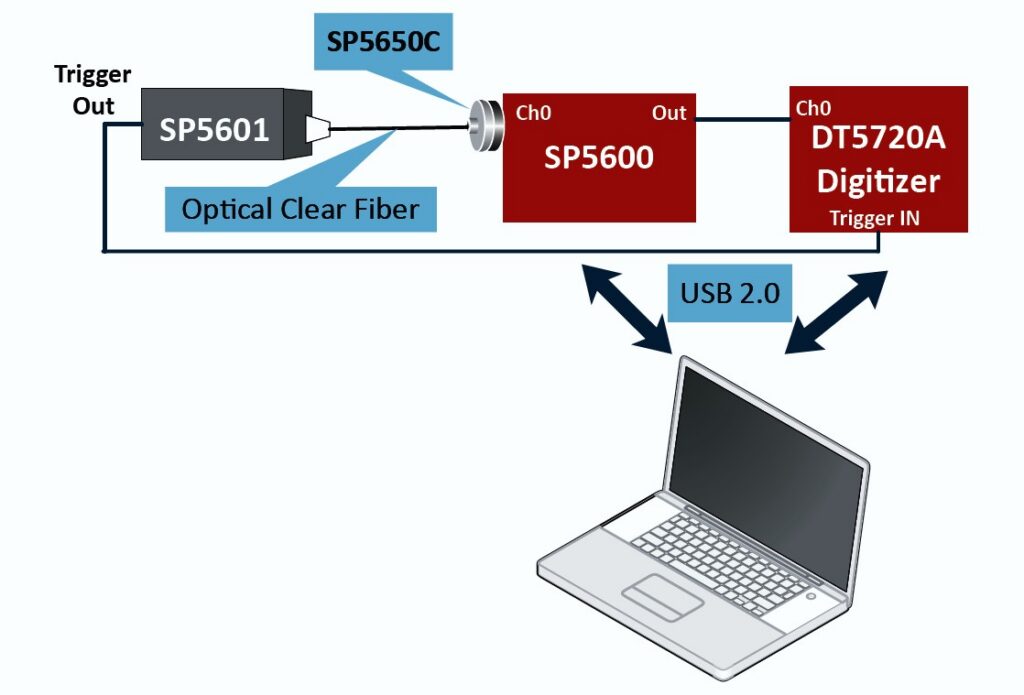
Experimental setup block diagram
- Plug in the SP5650A into one channel of SP5600 and connect the analog output to DT5720A channel 0.
- Remove the protection cover of the SP5601 and SP5650A, spread the optical grease on both ends of the optical fiber and connect them.
- Use internal trigger mode on SP5601 and connect its trigger output on the DT5720A trigger IN.
- Connect via USB the modules to PC and power ON the devices.
- Use the default software values or optimize the parameters to perform the experiment.
Results
The probability density function of the emitted number of photons per pulse can be estimated by the evaluation of the area underneath every peak. Two different hypothesis can be investigated to evaluate the statistical model and mean number of photoelectrons: Model Independent (the mean photon number is nothing but the mean) and Poissonian hypothesis (mean value obtained by presuming a pure Poissonian behaviour and by referring to the probability P(0) of having no fired cell when the expected average value).
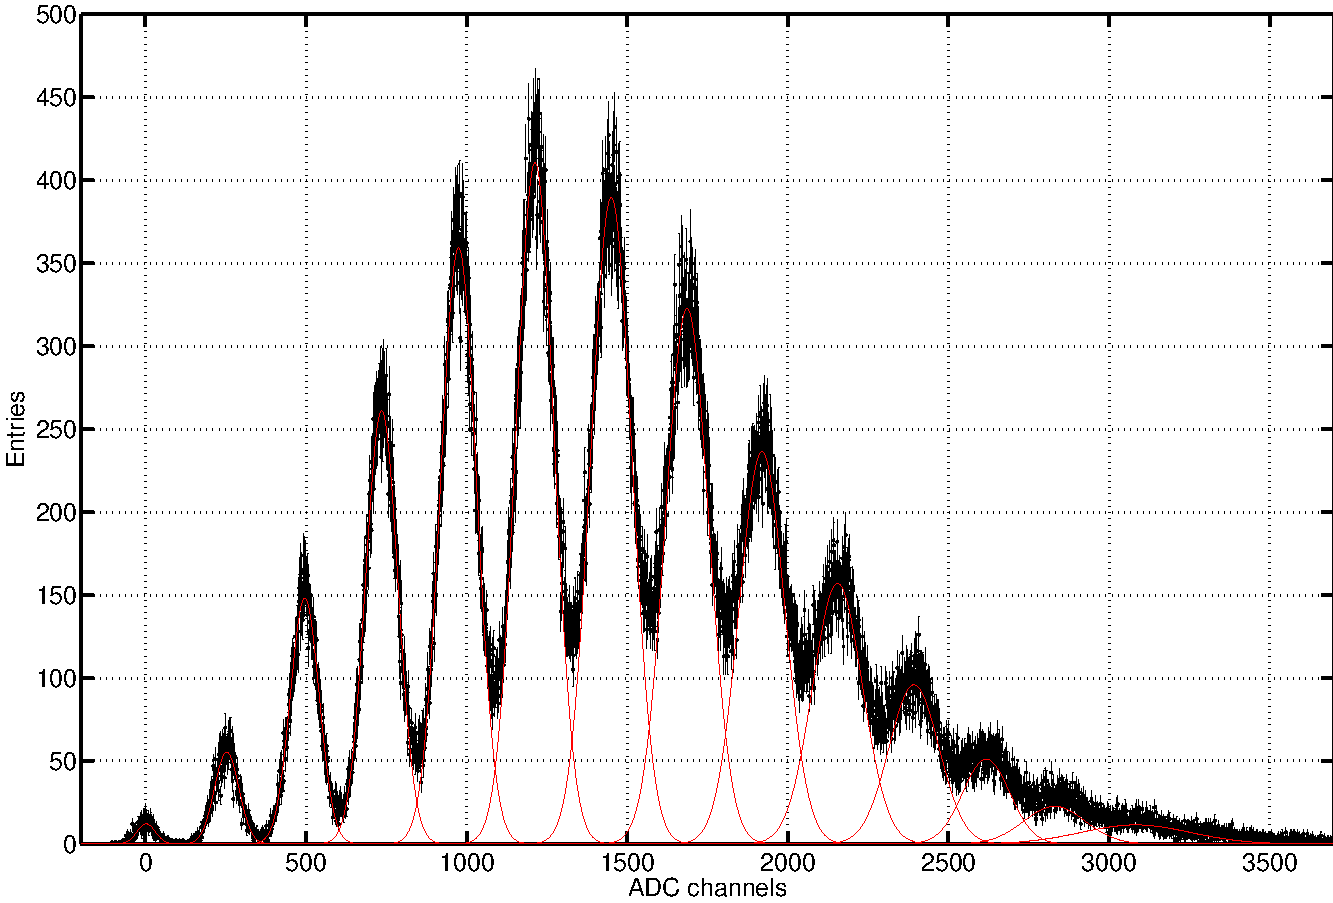
Photoelectron spectrum proving a LED source measured with Hamamatsu SiPM. The individual Gaussians are shown in red.
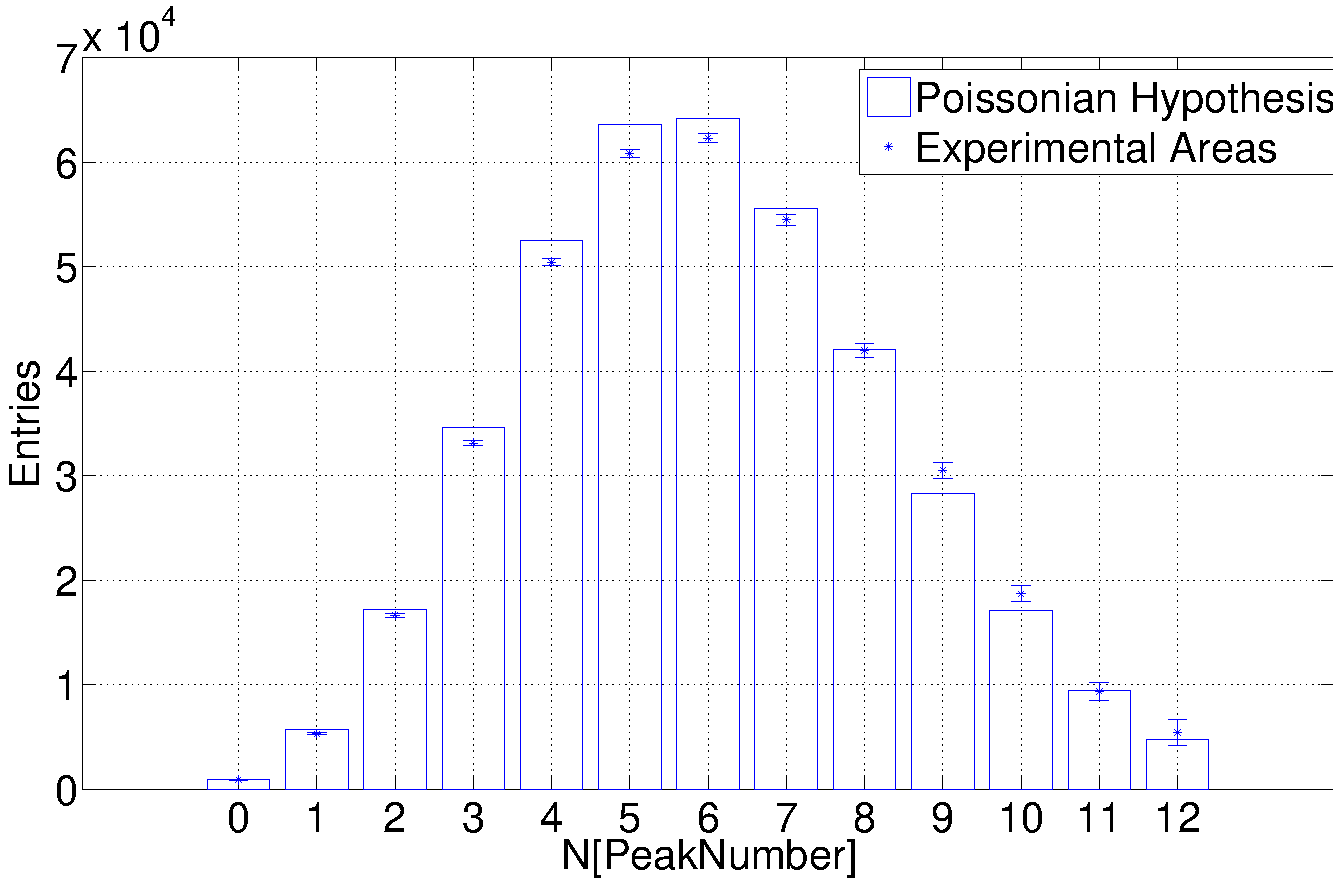
Data from the light spectrum compared to a simple Poissonian