| Difficult | Execution Time | Data Analysis | Radioactive Sources |
|---|---|---|---|
| Yes | Yes |
Hardware setup
This experiment guide is referred to the SP5701 educational kit.
Equipment: SP5701 – EasyPET Kit
| Model | SP5700 | DT5770 | Additional Tool |
|---|---|---|---|
| Description | EasyPET | Desktop Multi-Channel Analyzer | 22Na Radioactive source (recommended: 1/2 inch disc, 10 μCi) |
Purpose of the experiment
Gamma spectroscopy studies by using a gamma radioactive sources and by analysing the signals produced by the interaction of the gamma with one of the scintillating crystals of the system.
Fundamentals
The EasyPET detector system is composed of two Silicon Photomultipliers (SiPM) coupled to scintillating crystals. The EasyPET operation principle is simple: the two small detector cells, each composed of a small scintillator crystal coupled to a silicon photomultiplier (SiPM), develop a signal when they detect a photon emitted by the source. In order to perform the gamma spectroscopy measurements using one of the two detector systems, it is important underline that the detector is characterized by a noise component, caused by spurious events occurring randomly and independently from the illumination field. This noise, called Dark Count Rate (DCR), depends mainly on the sensor technology and on the operating temperature, with a rate from 100kHz up to several MHz per mm2 at 25°C. The DCR decreases with the lowering of the temperature (about a factor 2 of DCR reduction every 8°C). In addition, the operating voltage has an impact on the DCR since it’s connected to the electric field and as a consequence to the active volume of the sensor and to the triggering probability of the charge carrier. This noise component affects the resolution of a generic gamma spectrum composed of system noise peak, Compton distribution and Photo-peak.
Carrying out the experiment
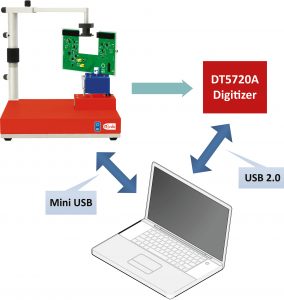
Experimental setup block diagram
- Mount the arm of the source holder on the column fixed to the system base, fix the U-shaped board to the top stepper motor and connect the flat cable to the U-shaped board and to the control unit.
- Connect to PC and power ON the system.
- Choose one detection system and connect its analog output to channel input of the DT5770, then use the comparator output to trigger the MCA and choose the threshold in mV of the signal output.
- Place the radioactive source as close as possible to the detector chosen and acquire the energy spectrum thanks to a Multi Channel Analyzer.
- Repeat the measurements with several gamma radioactive source in order to study the linearity system.
Results
The γ-spectrum shows the Compton continuum, related to the continuum of energies released by the Compton scattered electrons, and the Photo-Peak, the full-energy peak corresponding to the photoelectric absorption of the incident gamma. The peak around zero represents the system noise. The conversion between the channels number and the energy can be performed by a calibration. The system linearity is checked by using several radioactive sources. If the response of the system is linear, the output signals are directly proportional to the incident gamma energies.
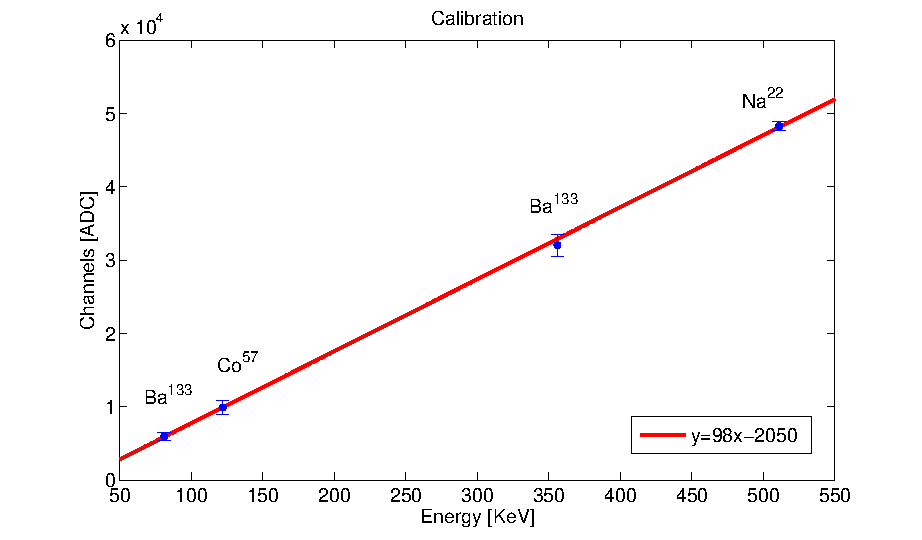
Energy Calibration
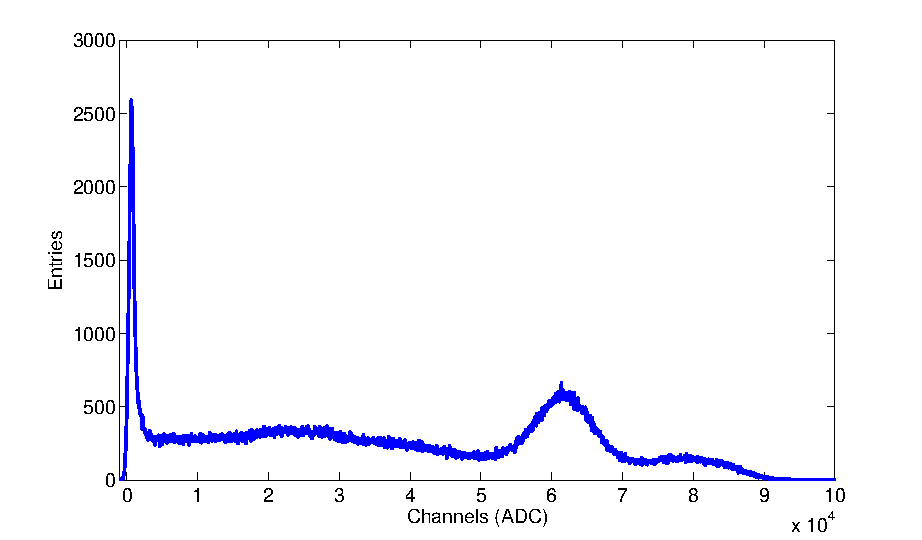
Energy spectrum of 22Na source