| Difficult | Execution Time | Data Analysis | Radioactive Sources |
|---|---|---|---|
| Yes | Yes |
Equipments
SP5640 – Backpack Detector
Gamma Radioactive Source ![]()
Purpose of the experiment
The analysis of the spectrum of the deposited energy by a γ ray in a detector discloses the essence of the interaction of high energy photons with matter and allows to learn by doing the detector related effects.
Fundamentals
For γ-energy less than 2MeV, the interaction with matter is dominated by Compton scattering and Photo-absorption. The analysis of the Compton continuum of the deposited energy and of the photo-peak conveys information on the characteristics of the decaying isotope as well as the effects due to the system noise, the detected photon statistics, the stochastic terms in the detector and the intrinsic resolution of the scintillator.
The experiment presumes to use 137Cs with its decays detected by a CsI scintillating crystal coupled to a Silicon Photomultiplier. The 137Cs source is particularly interesting due to its low energy X ray line at 30 keV and the high energy gamma emission at 662 keV. The former is relevant to optimize the lower detection limit of the system; the latter is a standard to evaluate the energy resolution. The use of the 2 lines and the analysis of the Compton spectrum characteristics allow to perform a rough measurement of the linearity with a single isotope.
Carrying out the experiment
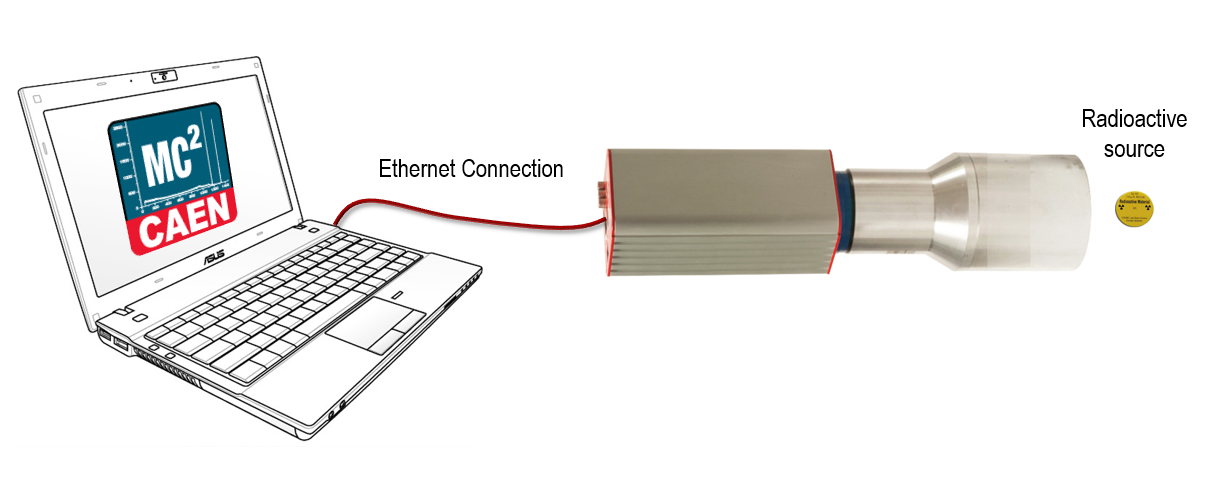
The experiment can be performed both by taking off the instrumentation from the backpack and using the backpack with the open zipper. To power ON γstream, press the ON/OFF button. Take care that the γstream internal battery is charged, otherwise use the external power system. Connect the Ethernet cable from γstream to the PC and configure the Ethernet network of your PC. Connect γstream to the MC2Analyzer software through Ethernet connection. Run the software and power ON the detector. Place the radioactive source close to the scintillator/under the central part of the backpack. Once the radioactive source is properly positioned, the spectrum can be recorded.
Results
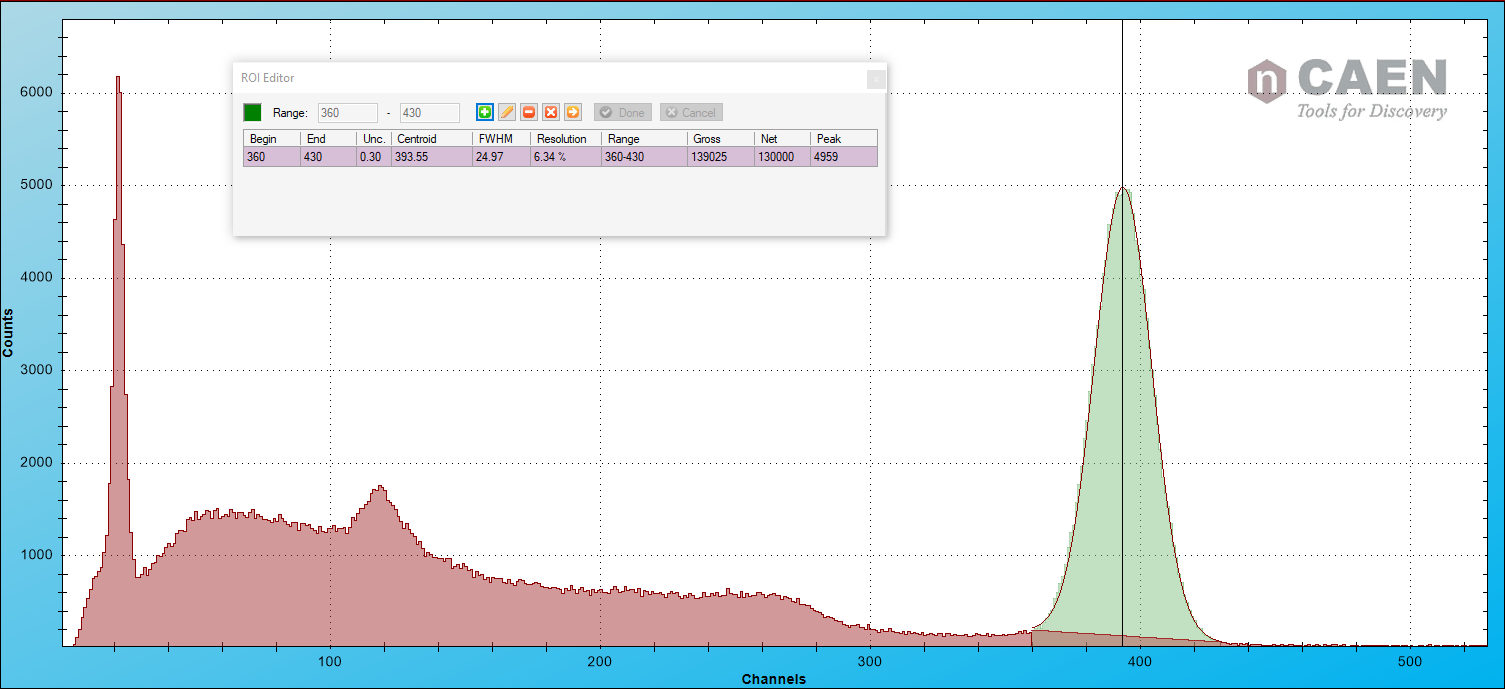
The figure shows a typical gamma spectrum, recorded with a very low energy threshold. The left over from the system noise is clearly visible, as well as the low energy line at 33 keV and the photo–peak. For this specific spectrum, the energy resolution on the 662 keV peak corresponds to:
Energy Resolution= FWHMpeak𝜇peak∗100 ~ 10%Energy Resolution= FWHMpeakμpeak∗100 ~ 10%
where FWHM peak and μpeak represent the full width at half maximum of the peak and the channel number of the peak centroid respectively.