| Difficult | Execution Time | Data Analysis | Radioactive Sources |
|---|---|---|---|
| No | Yes |
Hardware setup
This experiment guide is referred to the SP5630EN educational kit. If you don’t have this kit, choose your own from the following list to visualize the related experiment guide: SG6113A, SG6113E – Educational Kit
Equipment: SP5630EN/ENP – Environmental Kit
| Model | i-Spector- S2570B | Additional Tool |
|---|---|---|
| Description | radiation detector systems | Gamma Radioactive Source |
Purpose of the experiment
The analysis of the spectrum of the deposited energy by a γ ray in a detector discloses the essence of the interaction of high energy photons with matter and allows to learn by doing the detector related effects.
Fundamentals
For γ-energy less than 2MeV, the interaction with matter is dominated by Compton scattering and Photo-absorption. The analysis of the Compton continuum of the deposited energy and of the photo-peak conveys information on the characteristics of the decaying isotope as well as the effects due to the system noise, the detected photon statistics, the stochastic terms in the detector and the intrinsic resolution of the scintillator. The experiment presumes to use 137Cs with its decays detected by a CsI scintillating crystal coupled to a Silicon Photomultiplier. The 137Cs source is particularly interesting due to its low energy X ray line at 30 keV and the high energy gamma emission at 662 keV. The former is relevant to optimize the lower detection limit of the system; the latter is a standard to evaluate the energy resolution. The use of the 2 lines and the analysis of the Compton spectrum characteristics allow to perform a rough measurement of the linearity with a single isotope. The same activity can be done with LYSO scintillating crystal as well.
Requirements
137Cs laboratory low intensity or LYSO crystal sample.
Carrying out the experiment
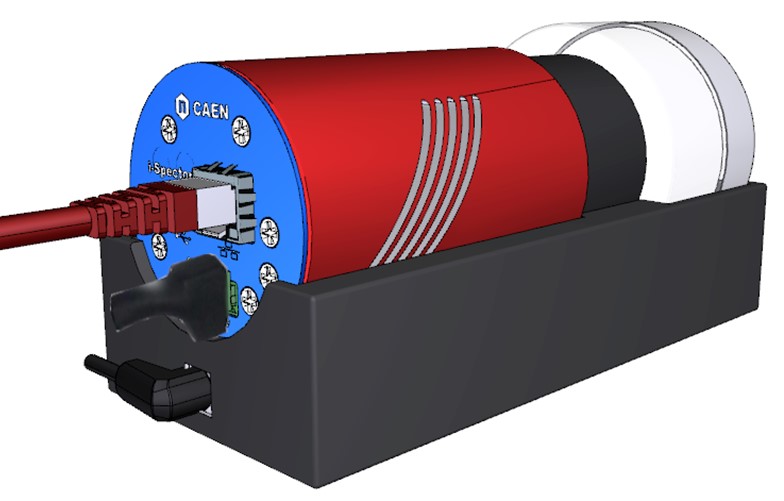
Experimental setup block diagram
- Put the i-Spector digital into the base and place a radioactive source into the empty box (you can use biadesive tape to fix the source into the box). You can use the LYSO crystal sample, if the 137Cs is not available.
- Power on the i-Spector and connect the Ethernet cable. Wait until the temperature is stable from the web interface (it can take half an hour from power on).
- Check the waveform, modify the threshold and gate width, if needed, then start the measurement of the energy spectrum.
- Take for example 2 minutes of acquisition with the 137Cs source sample by setting the corresponding acquisition time.
- Select the ROI peak, then check the values reported in the FWHM and Centroid fields.
Results
The figure shows a typical gamma spectrum, recorded with a very low energy threshold. The low energy line at 32 keV and the photopeak are clearly visible. For this specific spectrum, the energy resolution on the 662 keV peak corresponds to:
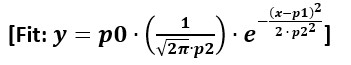
Where = full width at half maximum of the peak, = channel number of the peak centroid.
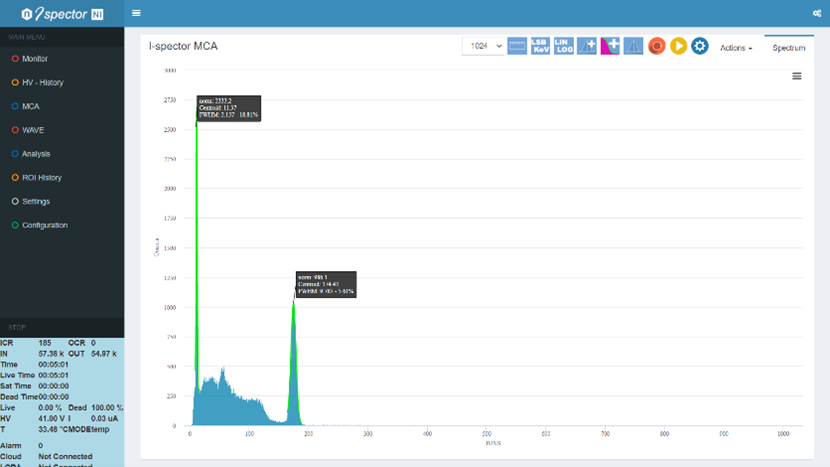
Energy spectrum with ROI and fit results