| Difficult | Execution Time | Data Analysis | Radioactive Sources |
|---|---|---|---|
| Yes | Yes |
Hardware setup
This experiment guide is referred to the SP5600C educational kit. If you don’t have this kit, choose your own from the following list to visualize the related experiment guide: SG6113C, SG6113E – Educational Kit
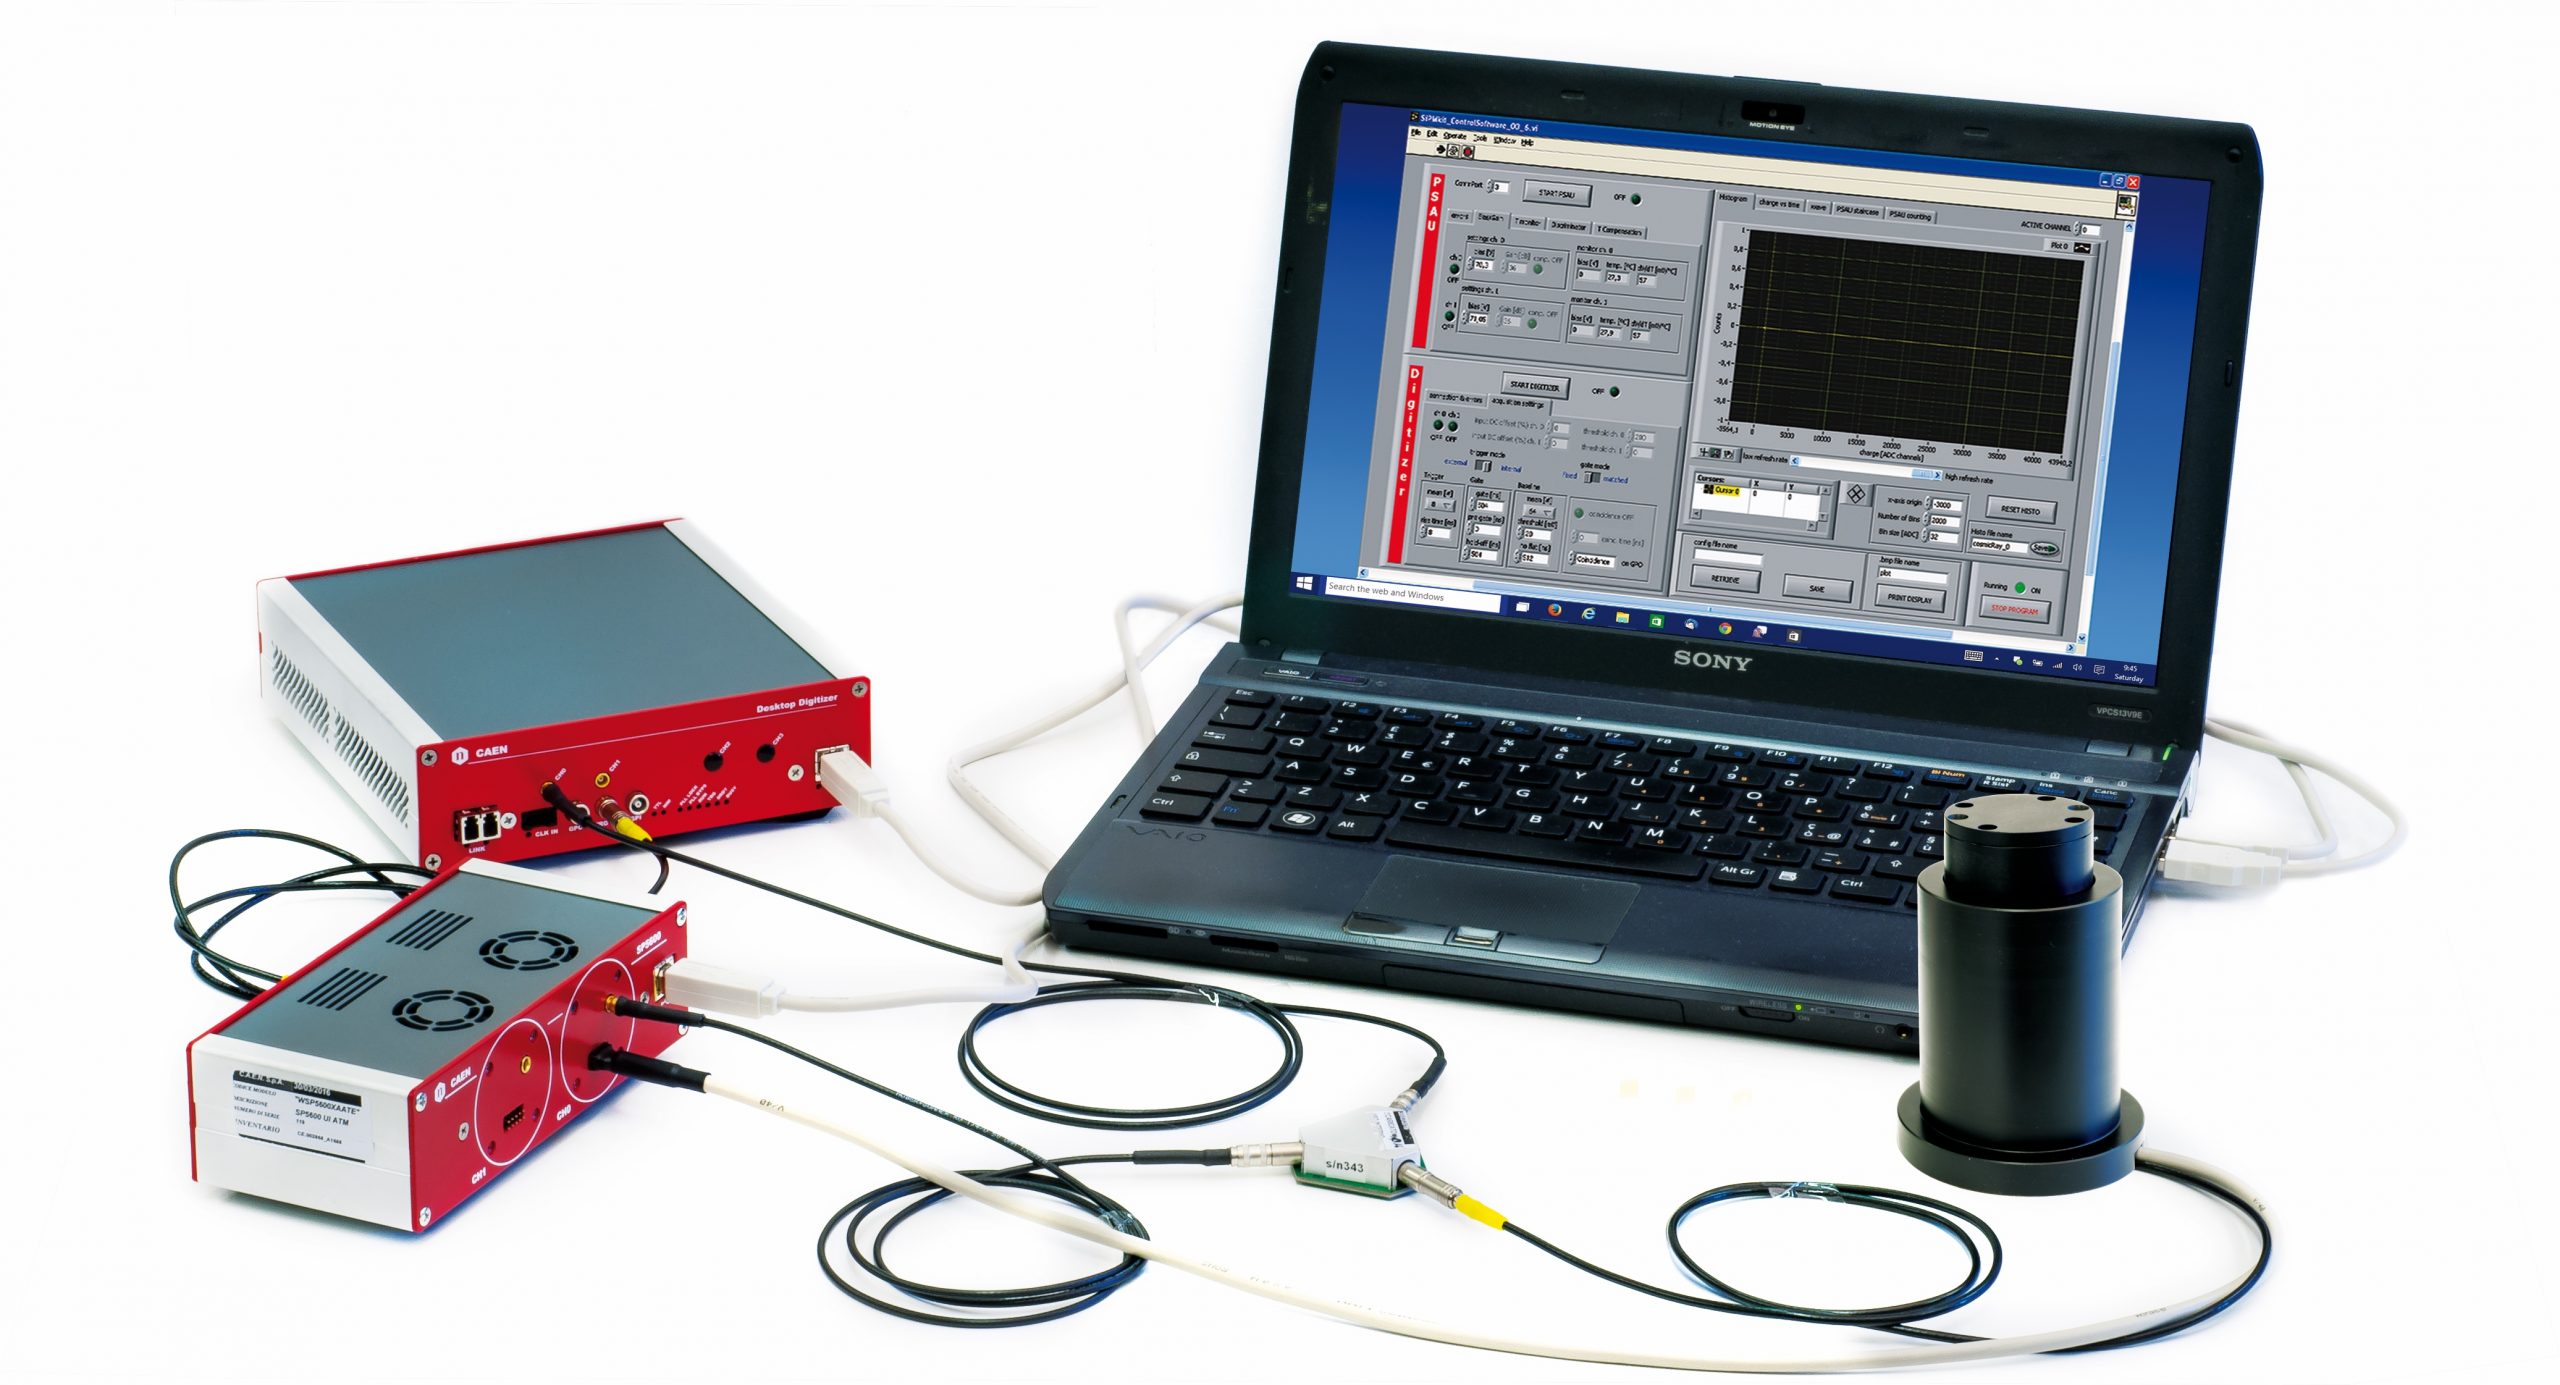
Equipment: SP5600C – Educational Gamma Kit
| Model | SP5600 | DT5720A | A315 | SP5606 | SP5607 | Additional Tool |
|---|---|---|---|---|---|---|
| Description | Power Supply and Amplification Unit | Desktop Digitizer 250 MS/s | Splitter | Mini Spectrometer | Absorption Tool | Gamma Radioactive Source |
Purpose of the experiment
Analysis of the spectrum of the deposited energy by a γ ray in a detector discloses the essence of the interaction of high energy photons with matter and allows to learn by doing the detector related effects.
Fundamentals
For γ-energy less than 2MeV, the interaction with matter is dominated by Compton scattering and Photo-absorption. The analysis of the Compton continuum of the deposited energy and of the photo-peak conveys information on the characteristics of the decaying isotope as well as the effects due to the system noise, the detected photon statistics, the stochastic terms in the detector and the intrinsic resolution of the scintillator. The experiment presumes to use 137Cs with its decays detected by a CsI crystal coupled to a Silicon Photomultiplier. The 137Cs source is particularly interesting due to its low energy X ray line at 32 keV and the high energy gamma emission at 662 keV. The former is relevant to optimize the lower detection limit of the system; the latter is a standard to evaluate the energy resolution. The use of the 2 lines and the analysis of the Compton spectrum characteristics allow to perform a rough measurement of the linearity with a single isotope.
Carrying out the experiment
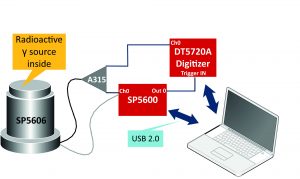
Block diagram of the experimental setup that makes use of the “Educational Gamma Kit”
The CsI scintillator crystal shall be coupled to the SiPM in the SP5607, through a thin layer of index matching grease to maximize the light collection. In order to avoid saturation, the output of the SiPM is divided using the A315 splitter: one branch is connected to the DT5720A and will be digitized. The other branch will be amplified by the SP5600 module, generating the trigger for the integration signal by the on-board leading edge discriminator. The discriminator threshold shall be defined looking at the spectrum and evaluating the dark count rate. Once this is properly set and the radioactive source is properly positioned, the spectrum can be recorded.
Results
The figure shows a typical gamma spectrum, recorded with a very low energy threshold. The left over from the system noise is clearly visible, as well as the low energy line at 32 keV and the photopeak. For this specific spectrum, the energy resolution on the 662 keV peak corresponds to:
Energy Resolution = ( FWHMpeak ⁄ μpeak ) * 100 ~ 10
Where: FWHMpeak = full width at half maximum of the peak and μpeak= channel number of the peak centroid.
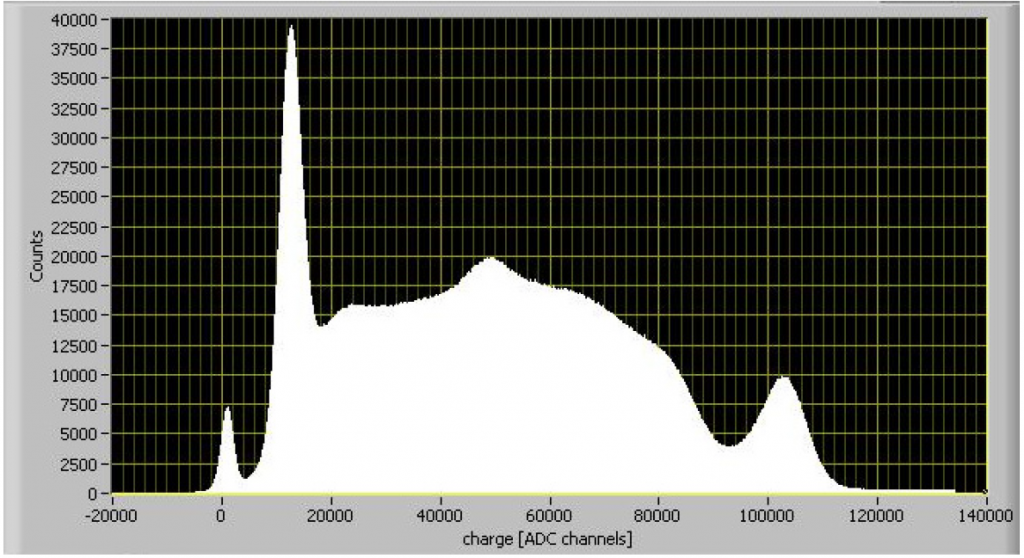
137 Cs spectrum