| Difficult | Execution Time | Data Analysis | Radioactive Sources |
|---|---|---|---|
| Yes | Yes |
Hardware setup
This experiment guide is referred to the SP5700 educational kit.
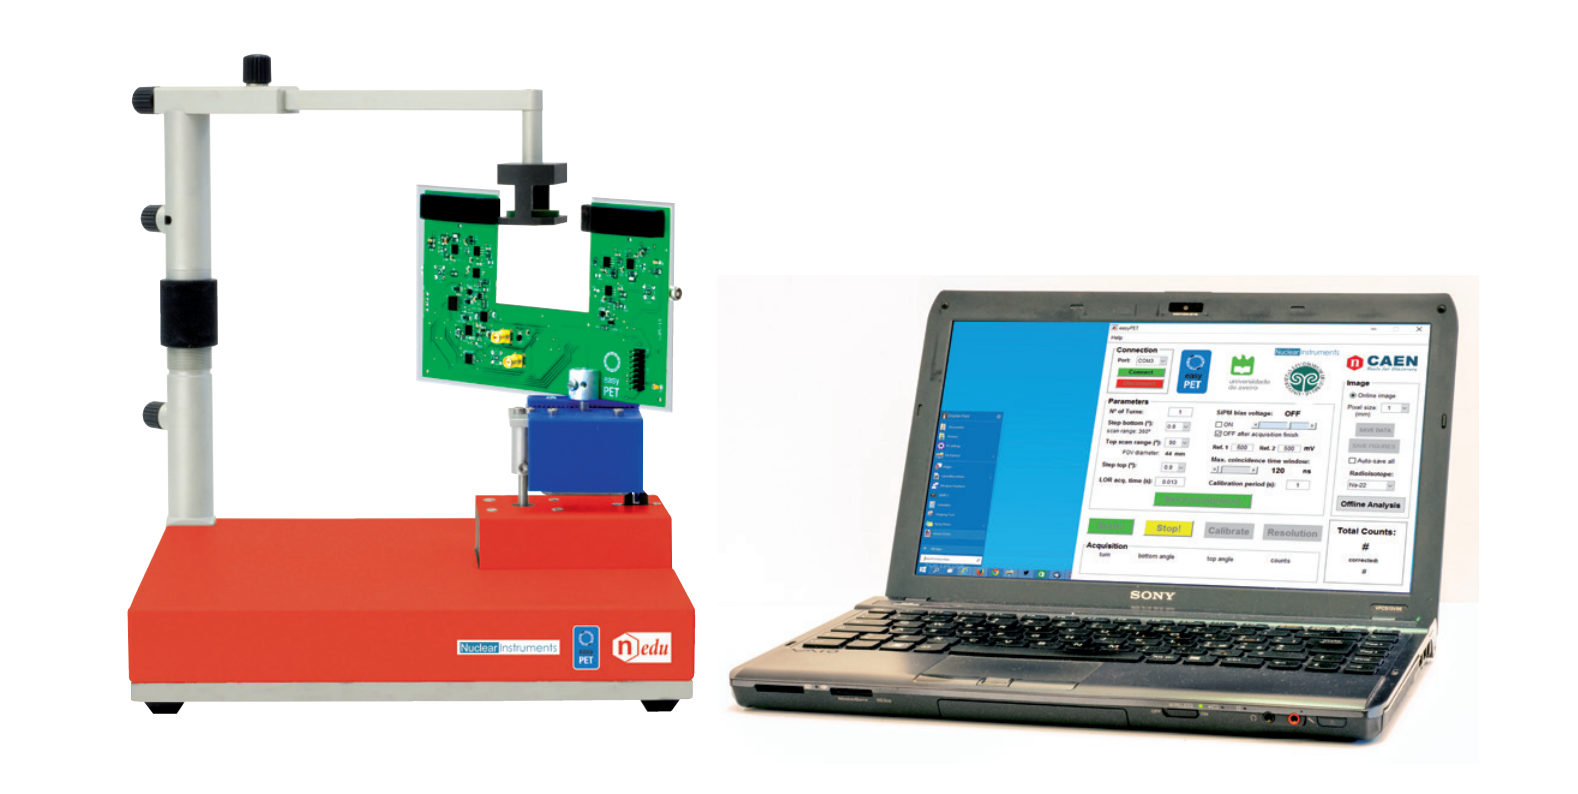
Equipment: SP5700 – EasyPET
| Model | SP5700 | Additional Tool |
|---|---|---|
| Description | EasyPET | 22Na Radioactive source (recommended: 1/2 inch disc, 10 μCi) |
Purpose of the experiment
Evaluation of the spatial resolution of a PET system composed of two detector modules.
Fundamentals
The main goal of the PET studies is to obtain a good quality and detailed image of an object by the PET scanner. The parameters involved and critical to good quality image formation are several: spatial resolution, sensitivity, noise, scattered radiations, and contrast. The spatial resolution is a fundamental characteristics of a tomographic system and its determination is mandatory for a PET system. The spatial resolution of a PET scanner is a measure of the ability of the device to faithfully reproduce the image of an object. It is empirically defined as the minimum distance between two points in an image that can be detected by a scanner. In the EasyPET the dominant factor determining the spatial resolution is represented by the width of the scintillating crystals. Another effect that degrades the spatial resolution of the system is the so-called sampling error. It is associated to the distribution of the lines of response in the field of view and is a direct consequence of the rotation and scanning granularity.
Carrying out the experiment

Experimental setup block diagram
- Mount the arm of the source holder on the column fixed on the system base, fix the U–shaped board to the top stepper motor and connect the flat cable to the U-shaped board and to control unit.
- Connect to PC and power ON the system.
- Set and optimize the parameters as bias voltage, threshold and coincidence time windows. In order to perform the spatial resolution measurement, the radioactive source is placed between the two detectors, on the line of response passing through the center. Its position is kept fixed while the system acquires the number of coincidence counts for successive scanning positions of the detector pair.
- The acquisition time is chosen in relation to the source activity to have enough statistics.
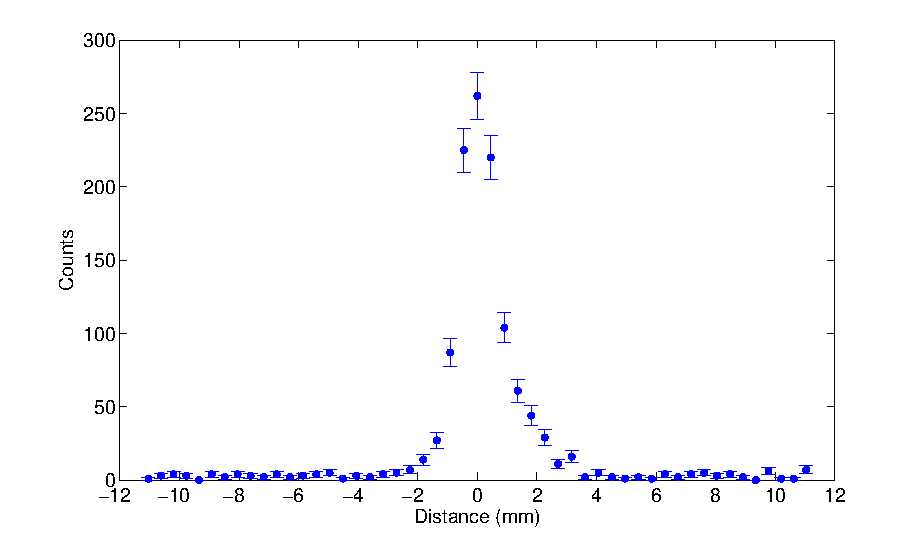
- The system response function is obtained plotting the number of coincidence counts for each position as a function of the distance between the source and the line of response (the distance is calculated as the product of the source-scanning axis distance and the scanning angle tangent).
- The resulting curve can be interpreted as the radioactive source distribution convoluted with the system spatial resolution.
Results
The estimated spatial resolution is ~ (1.45 ± 0.4) mm, which is comparable to the spatial resolution of the small animal PET systems.
Counting frequency of the beta rays as a function of the number of crossed paper sheets.
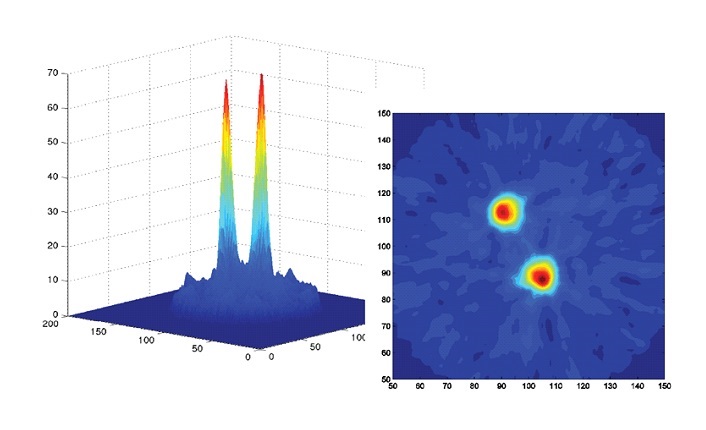
22Na sources, 5 μCi, 2.7 mm Ø and 9 mm apart