
| Difficult | Execution Time | Data Analysis | Radioactive Sources |
|---|---|---|---|
| Yes | Yes |
Hardware setup
This experiment guide is referred to the SP5640 educational kit. If you don’t have this kit, choose your own from the following list to visualize the related experiment guide:
SG6118B – Emulation Kit
Equipment
SP5640 – Backpack Detector
Additional Gamma Radioactive Source ![]()
Purpose of the experiment
Study the characteristics of the 137Cs spectrum, with special relevance given to the low energy spectrum. The student can learn effects related to the experimental observation of a gamma decay and have basic information about the experimental setup used in gamma spectroscopy. Estimate the energy of the backscatter peak and of the Kα line.
Fundamentals
The Compton effect is linked with experimental issues, since it is caused by the interaction of photons with the electrons instrument that measure the gamma radiation. In a real detector setup, some photons can and will undergo one or potentially more Compton scattering processes (e.g. in the housing material of the radioactive source, in shielding material or material otherwise surrounding the experiment) before entering the detector material. This leads to a peak structure, the so-called backscatter peak.
The basic principle for the backscatter peak formation is the following: gamma-ray sources emit photons isotropically, some photons will undergo a Compton scattering process with a scattering angle close to 180° and some of these photons will subsequently be detected by the detector. The result is an excess of counts in the Compton part of the spectrum, the so-called backscatter peak. This peak has an energy approximately equal to the photopeak energy minus the Compton edge energy.
Carrying out the experiment
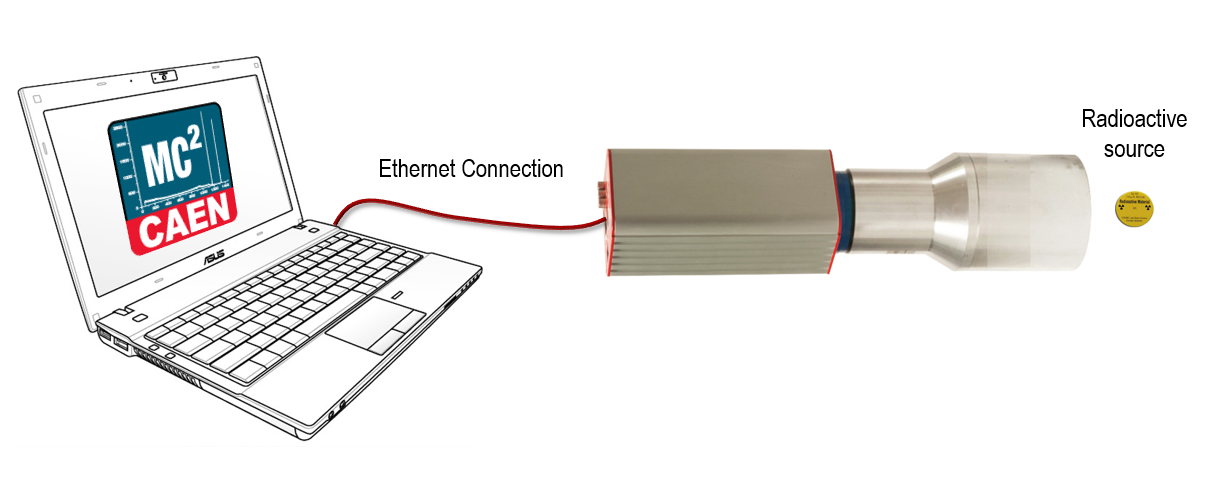
The experiment can be performed by taking off the instrumentation from the backpack. To power ON γstream, press the ON/OFF button. Take care that the γstream internal battery is charged, otherwise use the external power system. Connect the Ethernet cable from γstream to the PC and configure the Ethernet network of your PC. Connect γstream to the MC2Analyzer software through Ethernet connection. Run the software and power ON the detector. Place the radioactive source close to the scintillator. Once the radioactive source is properly positioned, the spectrum can be recorded.
 Results
The user can calibrate the system by using the spectrum itself. The backscatter peak and the Kα line can be identified. After calibrating the spectrum, it is possible to estimate the energy of the two peaks and compare them with theoretical predictions.
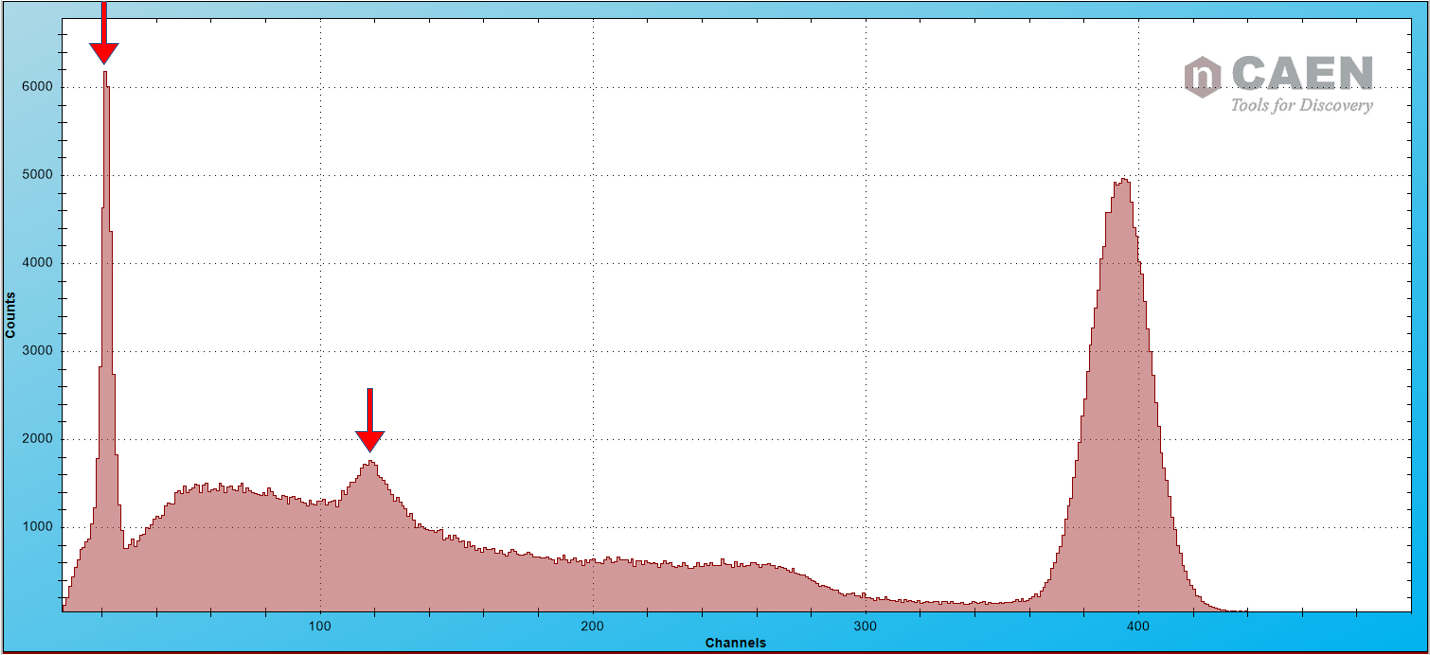
Plot of the 137Cs spectrum acquired by the MCA. The backscatter peak and the Kα line are indicated with the red arrows.