| Difficult | Execution Time | Data Analysis | Radioactive Sources |
|---|---|---|---|
| Yes | Yes |
Hardware setup
This experiment guide is referred to the SP5600C educational kit. If you don’t have this kit, choose your own from the following list to visualize the related experiment guide: SG6114B, SG6114C, SG6114E – Emulation Kit.
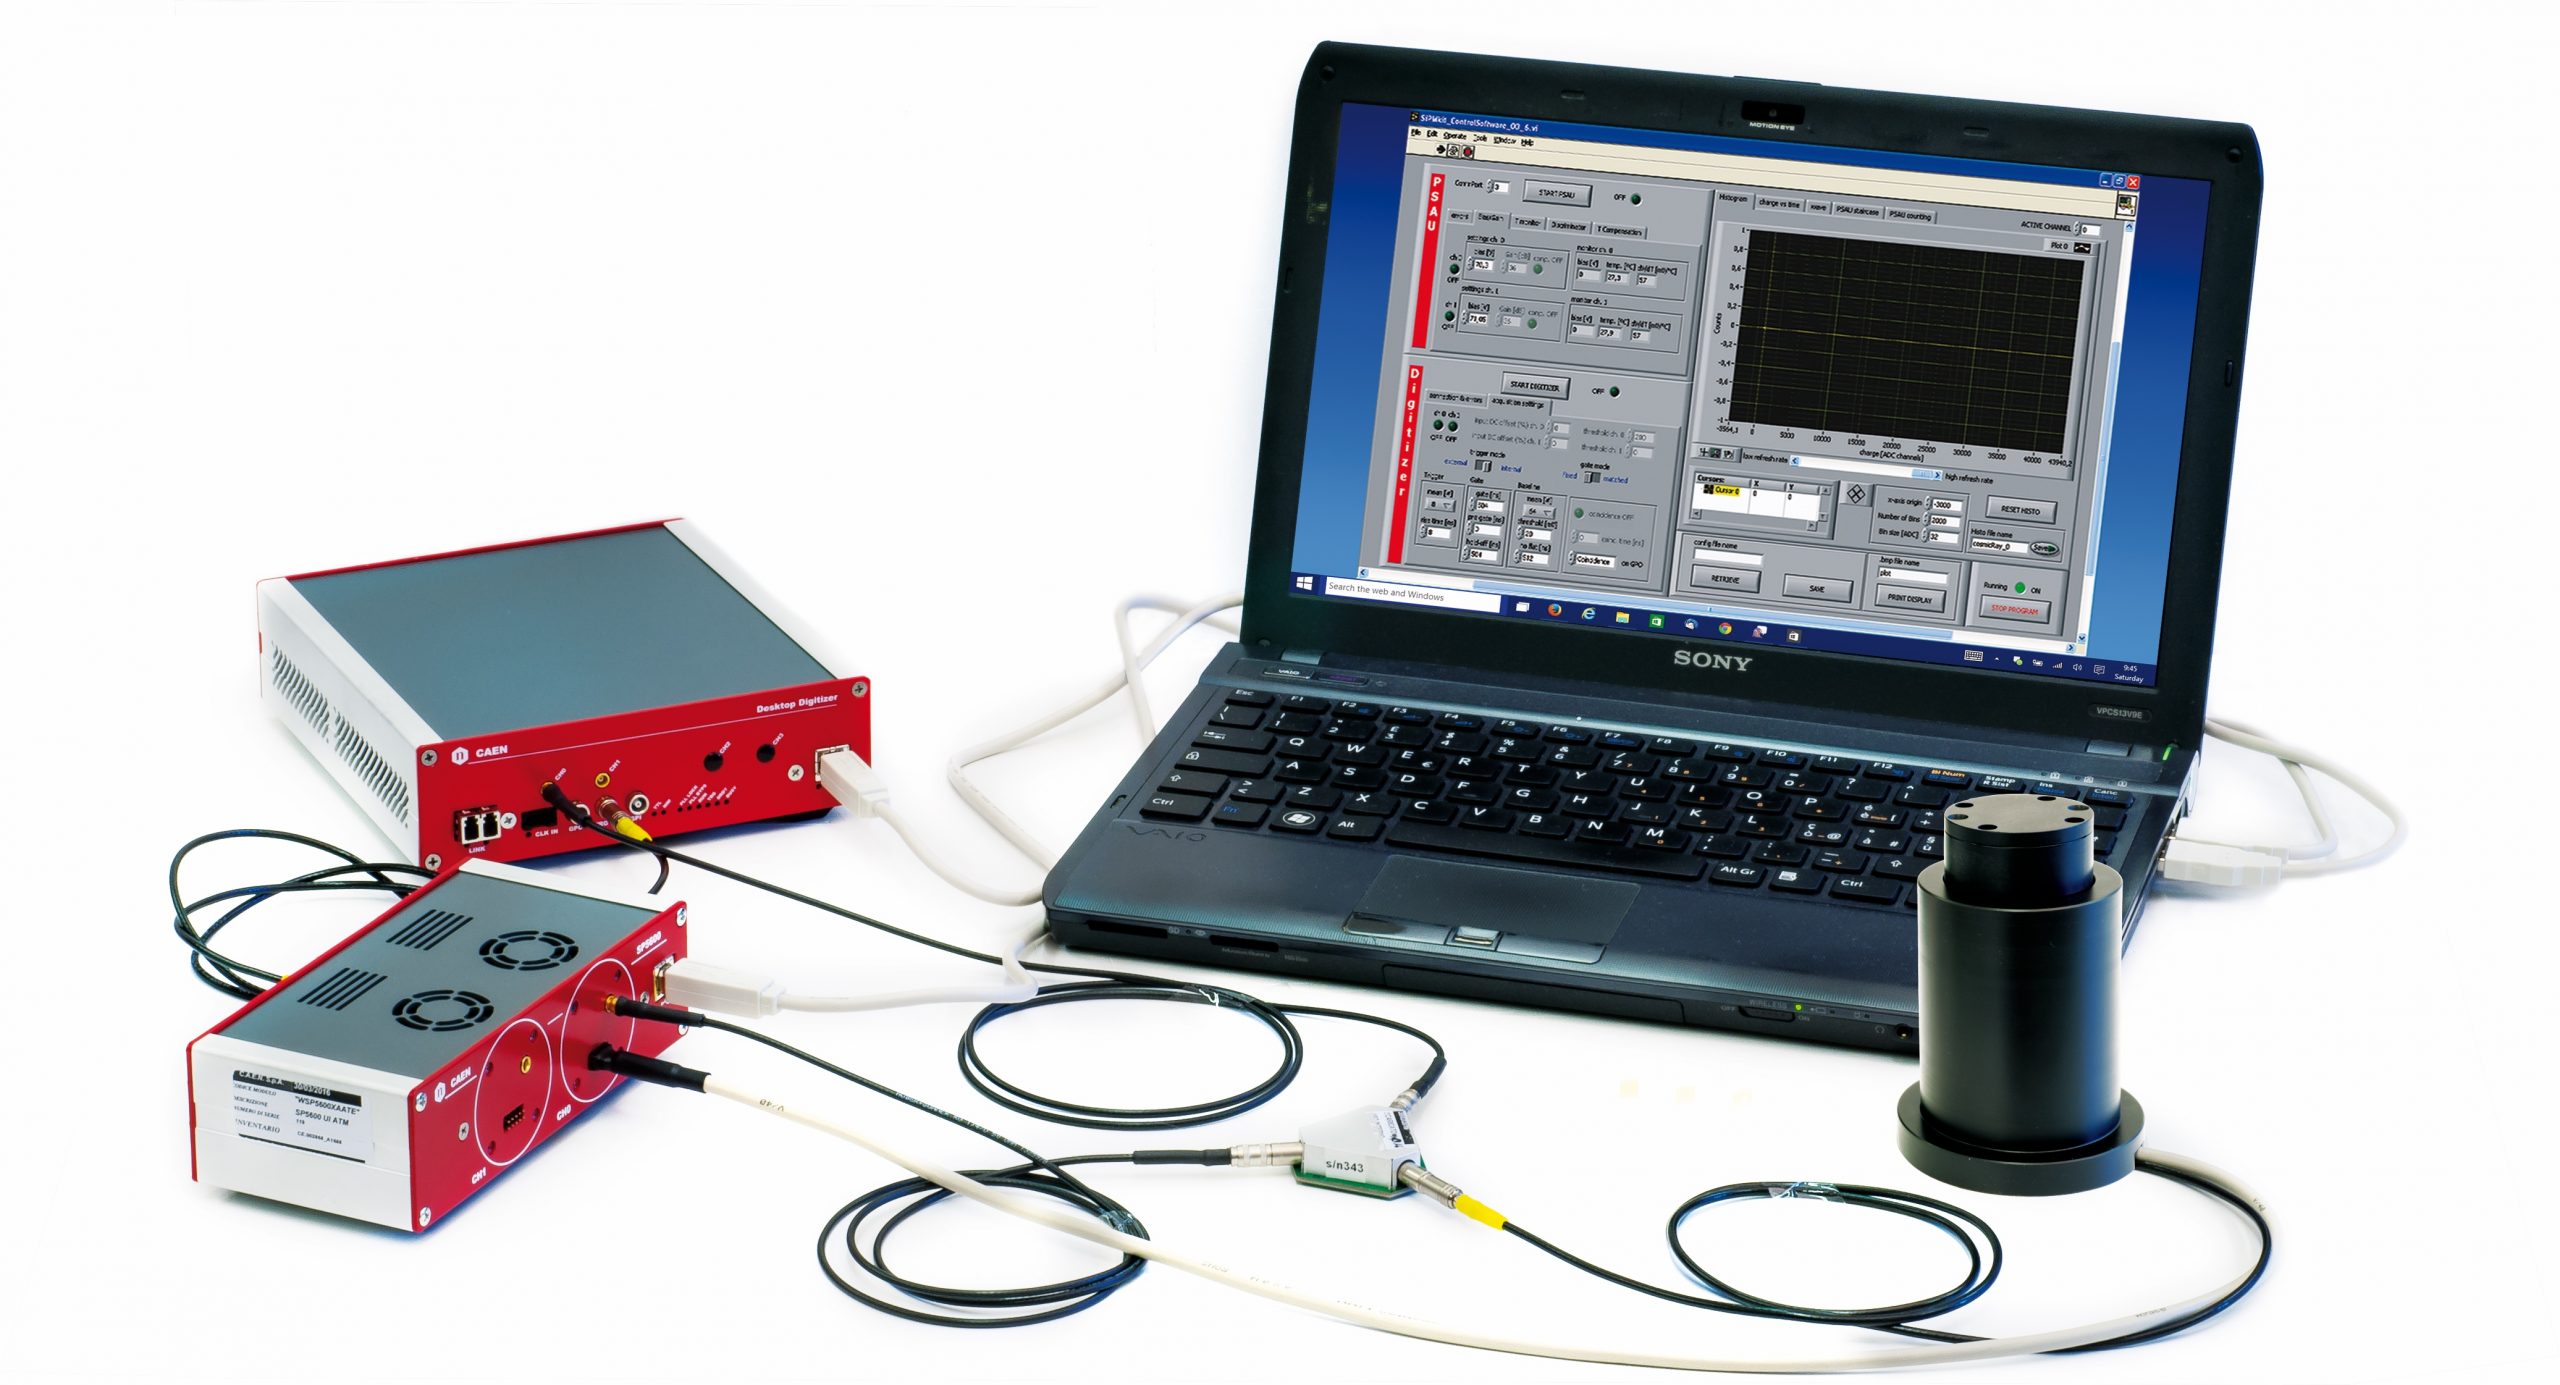
Equipment: SP5600C – Educational Gamma Kit
| Model | SP5600 | DT5720A | A315 | SP5606 | SP5607 | Additional Tool |
|---|---|---|---|---|---|---|
| Description | Power Supply and Amplification Unit | Desktop Digitizer 250 MS/s | Splitter | Mini Spectrometer | Absorption Tool | Gamma Radioactive Source |
Purpose of the experiment
Recording and comparing the γ-energy spectra of several radioactive sources is the main goal of the experiment. The photo-peaks are used to calibrate the response of the system and to measure the energy resolution.
Fundamentals
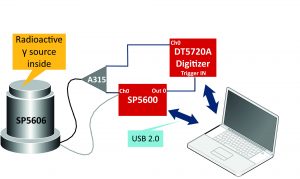
Block diagram of the experimental setup that makes use of the “Educational Gamma Kit”
Linearity and energy resolution are the main figures of merit of a spectrometric system. In the proposed experiment, based on a scintillating crystal coupled to a Silicon Photomultipliers, deviations in the linearity may be due to the sensor or the front-end electronics saturation. The student is guided through the analysis of the response curve using a series of isotopes up to the MeV energy by a 60Co source and to disentangle the different effects. At the same time, the energy resolution of the system is measured by the width of the photo-peaks and the results compared to what is expected by the fluctuations in the number of detected scintillation photons, the system noise, the sensor stochastic effects, the intrinsic resolution of the scintillator. This is following an initial activity on the optimization of the operating parameters by an analysis of the photo-peak position and the resolution for a single isotope.
Carrying out the experiment
The scintillator crystal shall be coupled to the SiPM in the SP5606, through a thin layer of index matching grease to maximize the light collection. In order to avoid saturation, the output of the SiPM is divided using the A315 splitter: one branch is connected to the DT5720A and will be digitized. The other branch will be amplified by the SP5600 module, generating the trigger for the integration signal by the on-board leading edge discriminator. The discriminator threshold shall be defined looking at the spectrum and evaluating the dark count rate. Once this is set and the radioactive source is properly positioned, the spectrum can be recorded.
Results
By fitting the photo-peaks with a Gaussian curve, the system linearity as a function of energy is verified. The peak widths is determining the energy resolution. At more advanced level, the interpretation of the results accounting for the system properties may be performed.
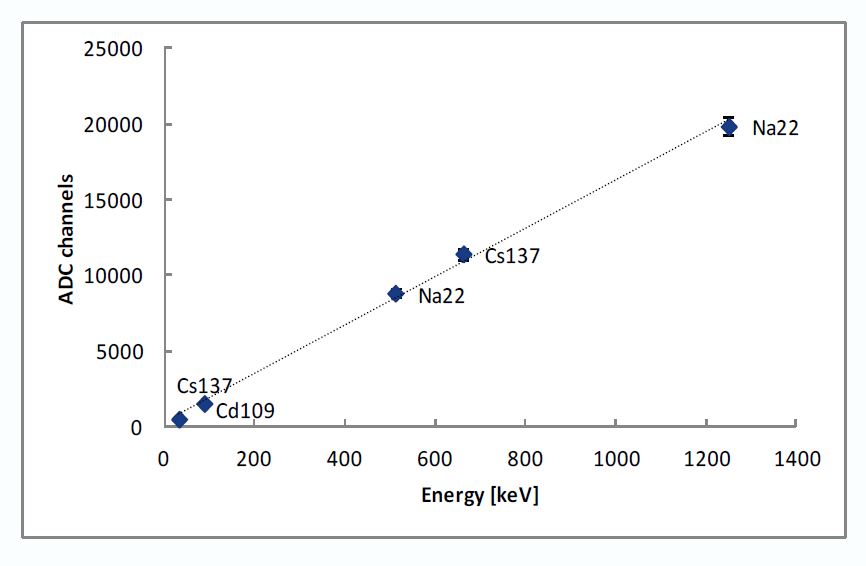
Energy calibration
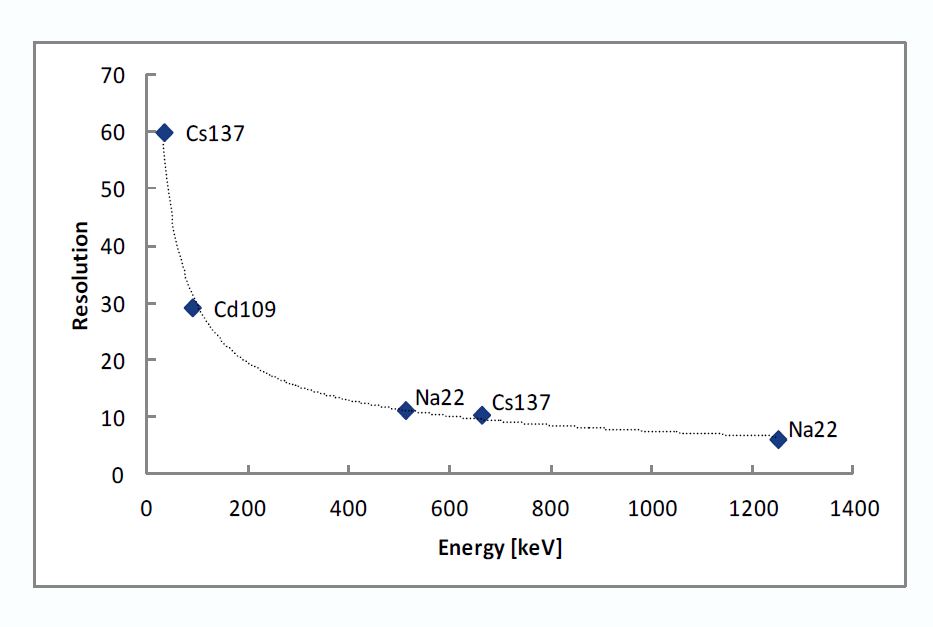
Energy dependence of the system resolution