| Difficult | Execution Time | Data Analysis | Radioactive Sources |
|---|---|---|---|
| No | 2 Gamma Radioactive Source |
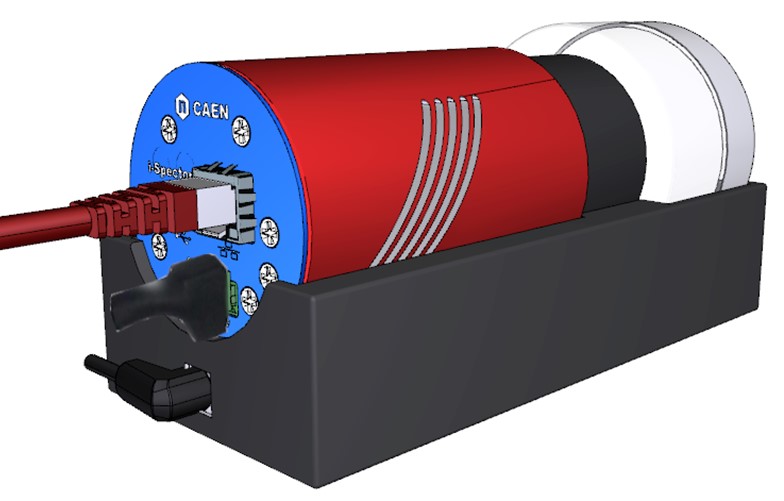
Hardware setup
This experiment guide is referred to the SP5630EN/ENP – Enviromental Kit. If you don’t have this kit, choose your own from the following list to visualize the related experiment guide: SG6114A, SG6114B, SG6114E – Emulation Kit.
Equipment: SP5630EN/ENP – Environmental Kit
| Model | i-Spector (S2570B) | Additional Tool |
|---|---|---|
| Description | Radiation Detector Systems | Gamma Radioactive Source |
Purpose of the experiment
Recording and comparing the γ-energy spectra of several radioactive sources is the main goal of the experiment. The photo-peaks are used to calibrate the response of the system and to measure the energy resolution.
Fundamentals
Linearity and energy resolution are the main figures of merit of a spectrometric system. In the proposed experiment, based on a scintillating crystal coupled to a Silicon Photomultipliers, deviations in the linearity may be due to the sensor or the front-end electronics saturation. The user is guided through the analysis of the response curve using a series of isotopes up to the MeV energy by a 60Co source and to disentangle the different effects. At the same time, the energy resolution of the system is measured by the width of the photo-peaks and the results compared to what is expected by the fluctuations in the number of detected scintillation photons, the system noise, the sensor stochastic effects, the intrinsic resolution of the scintillator. This is following an initial activity on the optimization of the operating parameters by an analysis of the photo-peak position and the resolution for a single isotope. The same activity can be done with the radioactive samples provided in the SP5630EN kit as well.
Requirements
Experimental setup block diagram
60Co laboratory low intensity or a couple of radioactive samples of the SP5630EN kit.
Carrying out the experiment
- Put the i-Spector digital into the base and place a radioactive source into the empty box (you can use biadesive tape to fix the source into the box). You can use the LYSO crystal sample, if the 60Co is not available.
- Power on the i-Spector and connect the Ethernet cable.
- Wait until the temperature is stable from the web interface (it can take half an hour from power on).
- Check the waveform, modify the threshold and gate width, if needed, then start the measurement of the energy spectrum.
- Acquisition for a time which can vary according to the source or sample activity.
- Select the ROIs and use the calibration tool to calibrate the spectrum.
Results
By fitting the photo-peaks with a Gaussian curve, the system linearity as a function of energy is verified. The peak widths determine the energy resolution. At more advanced level, the interpretation of the results accounting for the system properties may be performed.
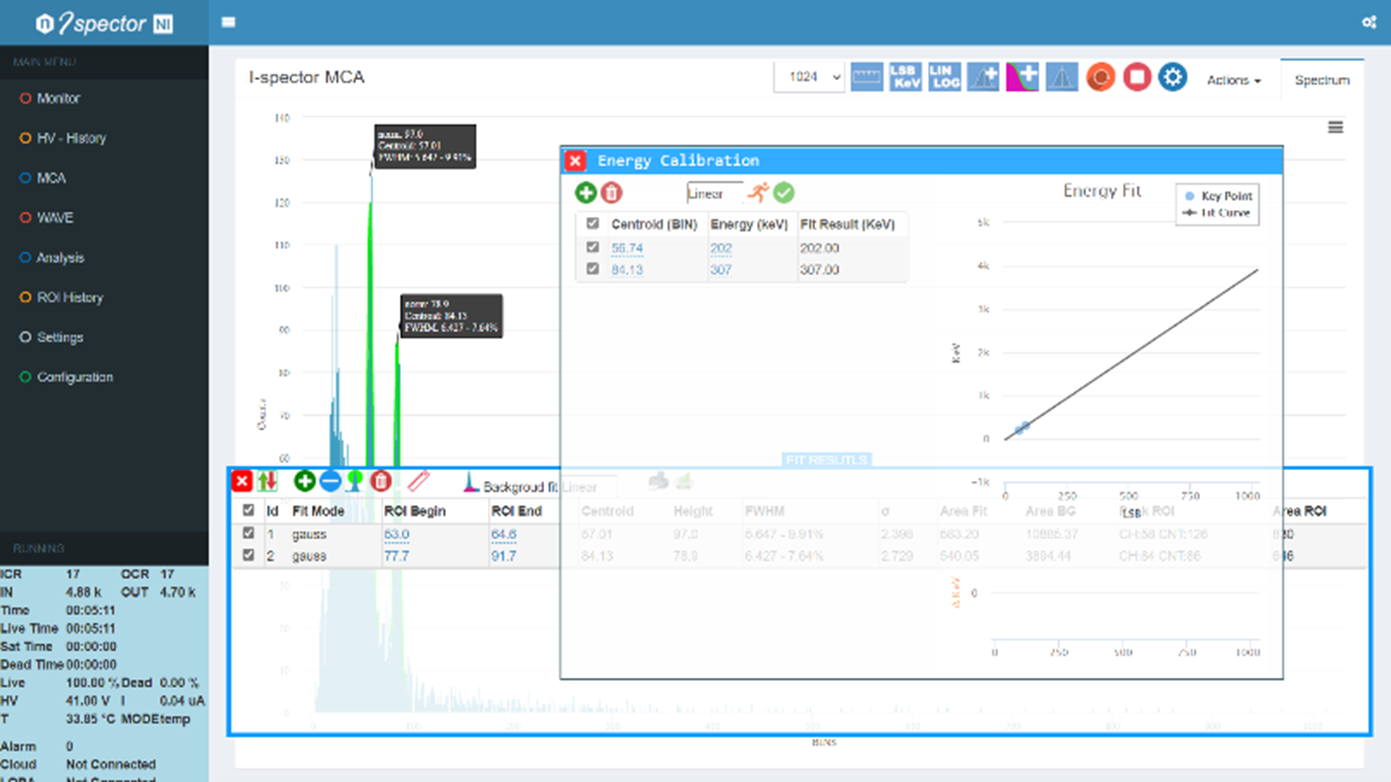
Linear dependency in the Energy Calibration