| Difficult | Execution Time | Data Analysis | Radioactive Sources |
|---|---|---|---|
| Yes | No |
Hardware setup
This experiment guide is referred to the SP5600E educational kit.
Equipment: SP5600 – Educational Photon Kit
| Model | SP5600 | DT5720A | SP5601 | SP5650C |
|---|---|---|---|---|
| Description | Power Supply and Application Unit | Desktop Digitizer 250 MS/s |
LED Driver | Sensor Holder for SP5600 with SiPM |
Purpose of the experiment
Study of the dependence of the main SiPM figures of merit on the bias voltage. Measurement of the breakdown voltage and identification of the optimal working point. The experiment requires the use of the LED source included in the kit.
Fundamentals
The main features of the SiPM are expected to depend on the bias voltage or, more specifically, on the overvoltage, the voltage in excess of the breakdown value:
- The gain is expected to depend linearly on the overvoltage.
- The triggering efficiency, i.e. the probability for a charge carrier to generate an avalanche by impact ionization, increases with the overvoltage till a saturation value is achieved. As a consequence, the Photon Detection Efficiency (PDE) increases together with the stochastic events (Dark Count Rate, Cross Talk and After Pulses) affecting the sensor response.
Actually, spurious events are expected to grow super-linearly and the determination of the optimal working point requires the definition of a proper figure of merit. Referring to the photon number resolving capability of the SiPM, the bias can be set to optimize the resolution power, i.e. the maximum number of resolved photons.
Carrying out the experiment
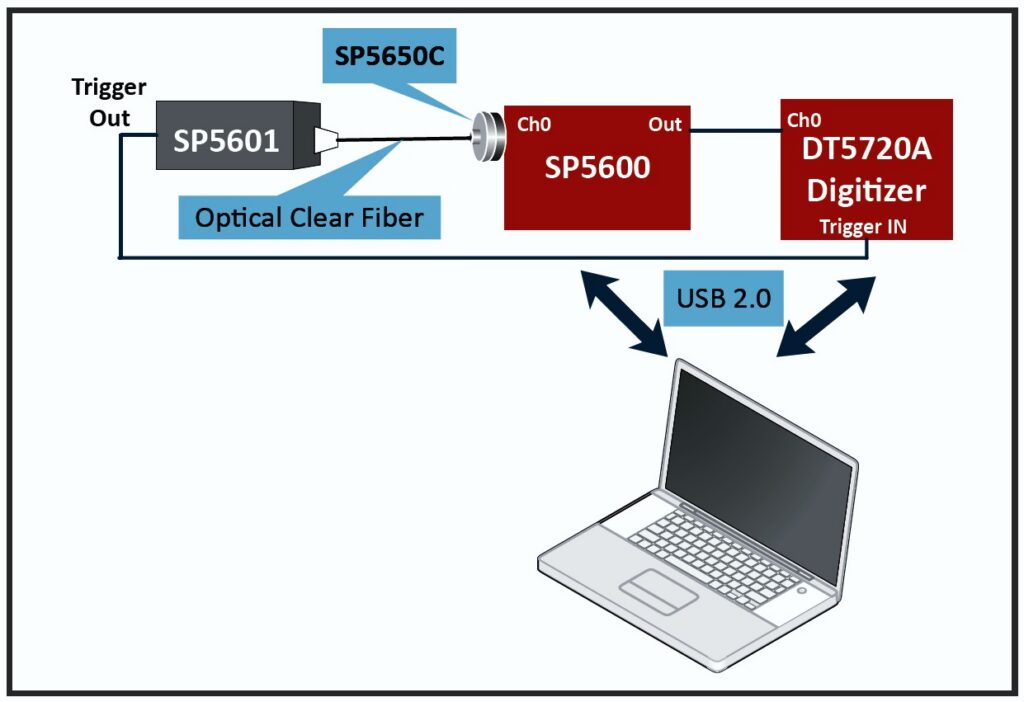
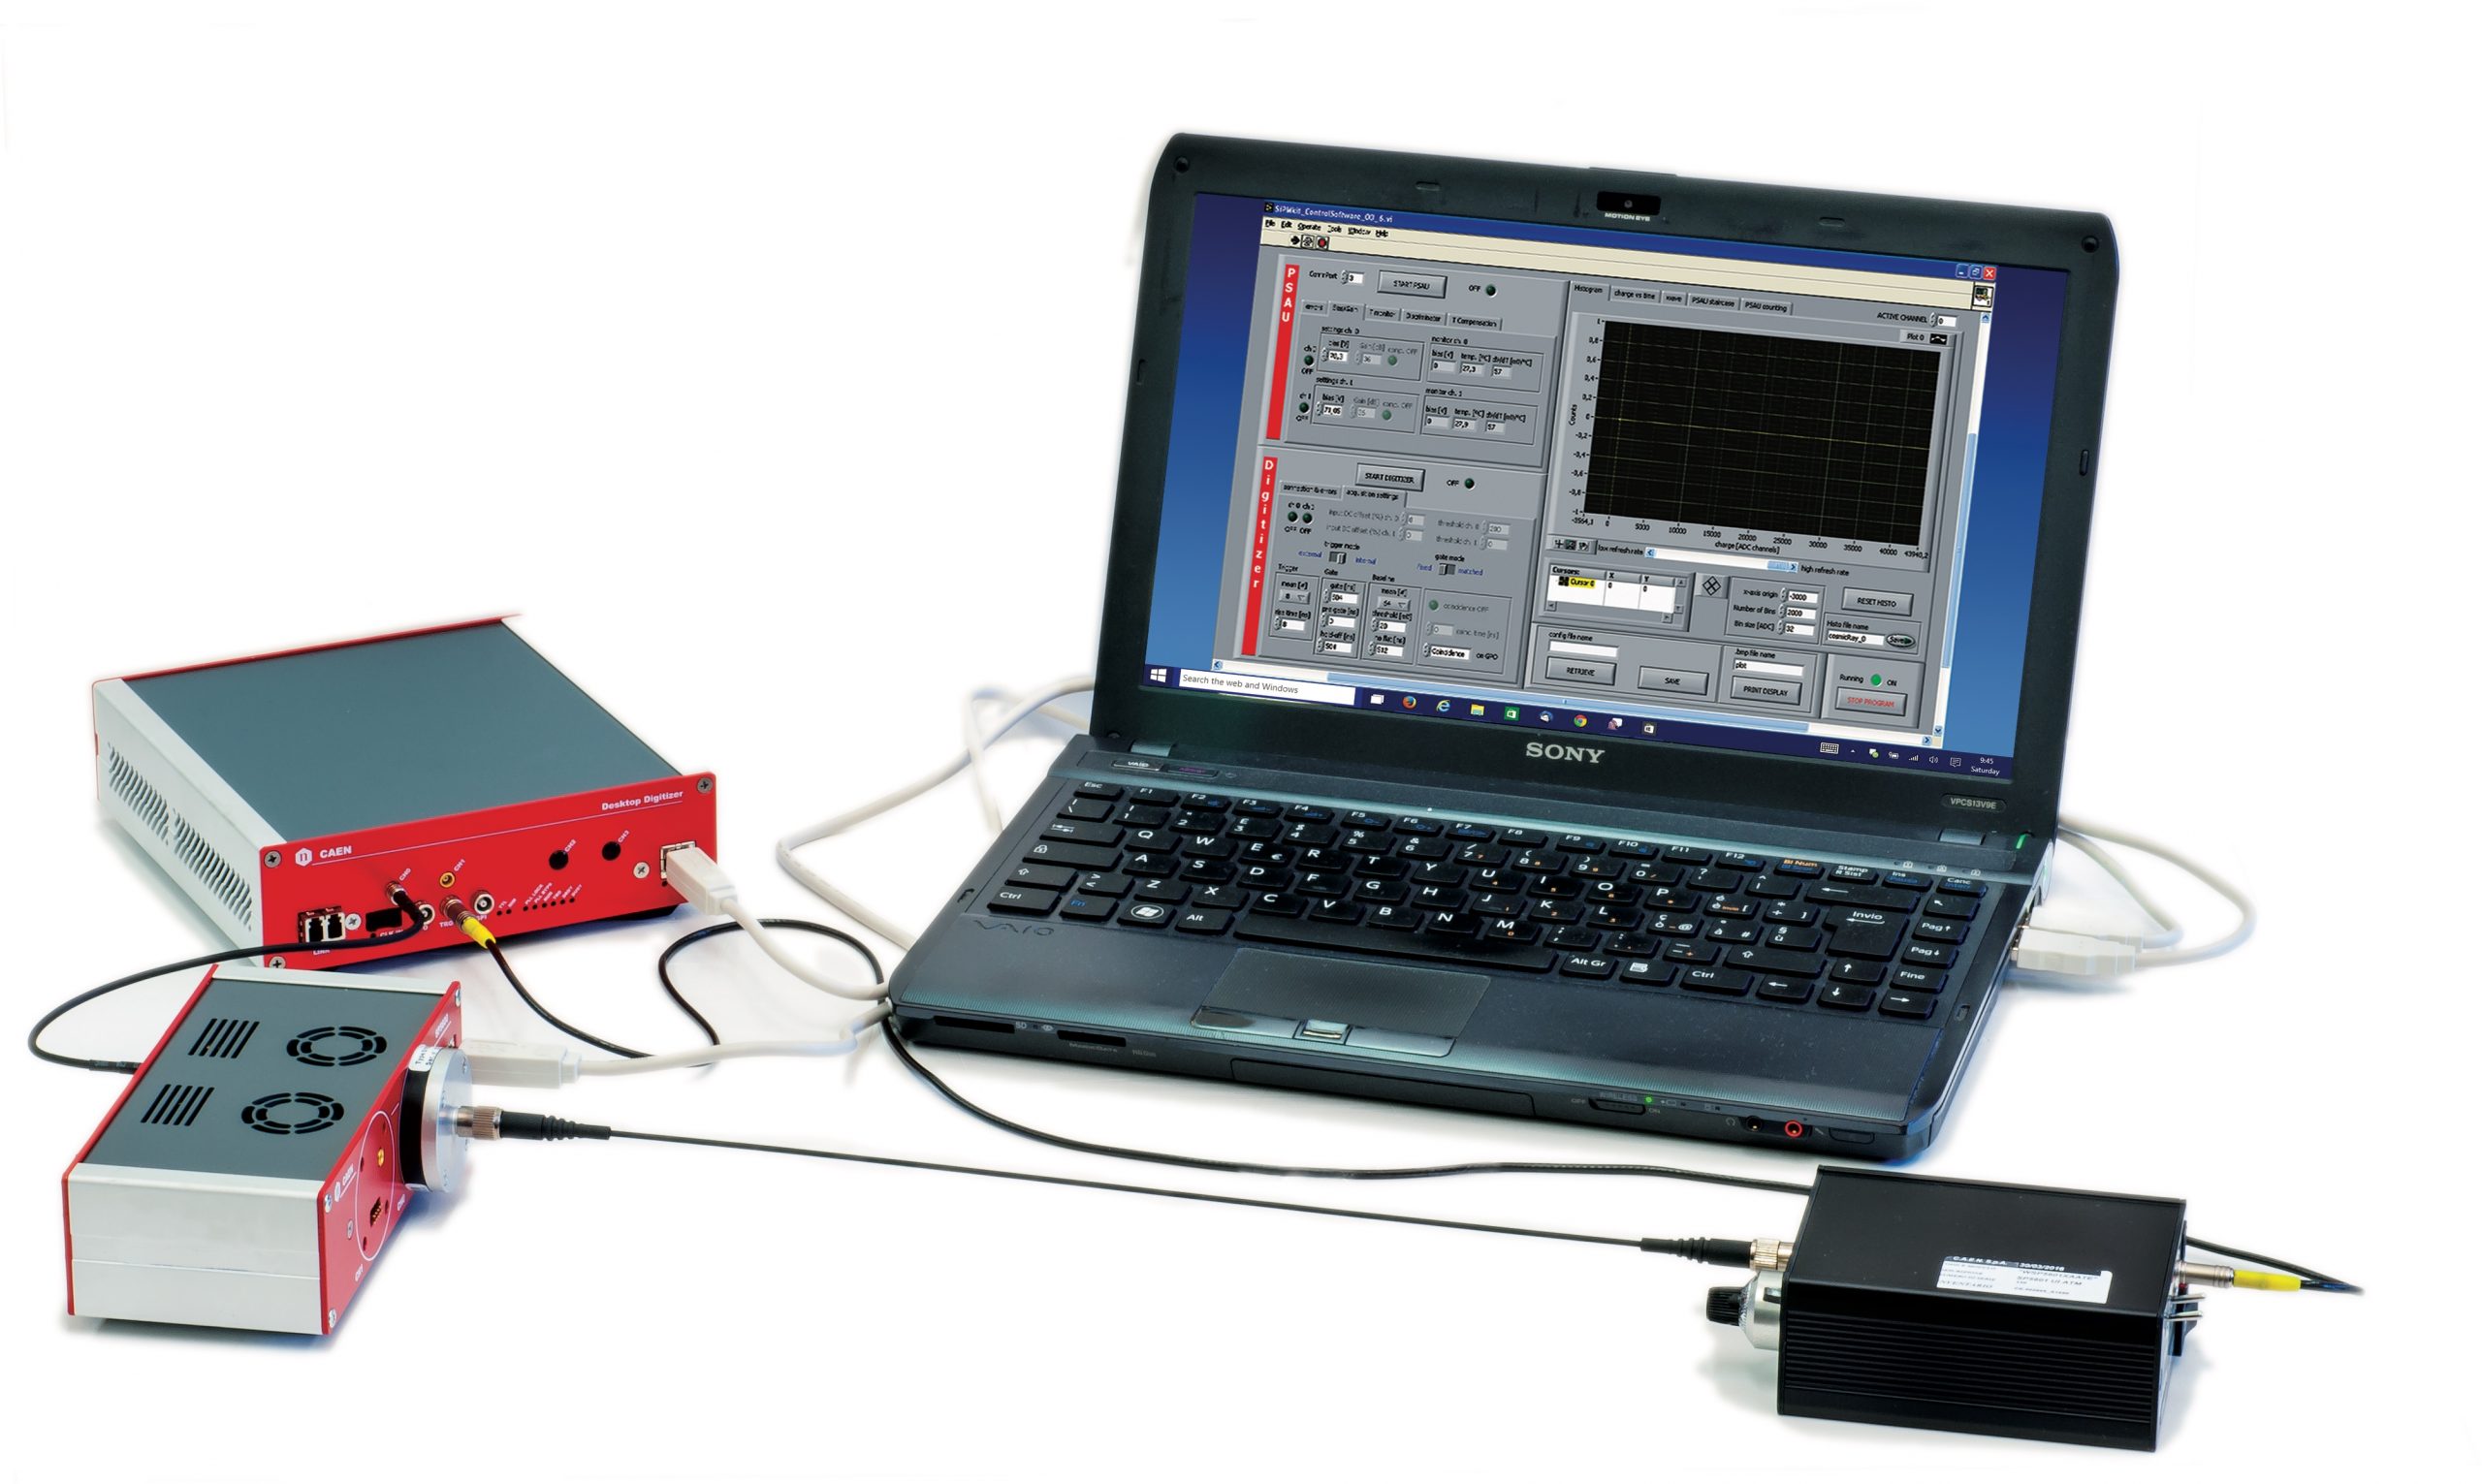
Experimental setup block diagram
- Mount one of the sensors (SP5650C) on the SP5600 and connect the analog output to the input of the DT5720A digitizer.
- Optically couple the LED and the sensor via the optical fiber, after having used the index matching grease on the tips.
- Set the internal trigger mode on the SP5601 and connect its trigger output on the DT5720A trigger IN.
- Connect via USB the modules to the PC and power ON the devices.
- Through the LabView graphical user interface (GUI), properly synchronize the signal integration and, for every voltage value, record the photon spectrum and measure directly the Dark Count and the Optical Cross talk. The measurement of the After Pulse is also possible but it requires most advanced analysis techniques.
Results
As exemplary illustration, the trend of the “gain vs. the bias” voltage is shown, allowing as well the measurement of the breakdown voltage corresponding to the value at zero gain. The optimal working point by a measurement of the resolution power on the multi-photon peak spectrum is also shown.
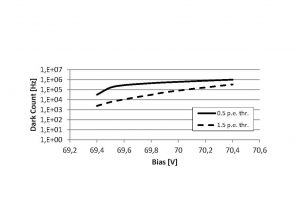
Dark count versus bias voltage
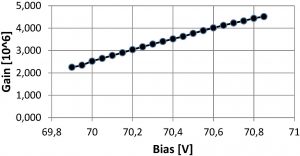
SiPM gain versus bias voltage
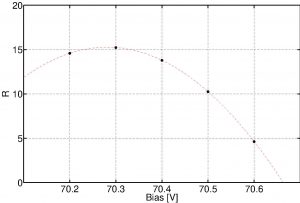
Scan of the resolution power R as afunction of the bias voltage