| Difficult | Execution Time | Data Analysis | Radioactive Sources |
|---|---|---|---|
| Yes | No |
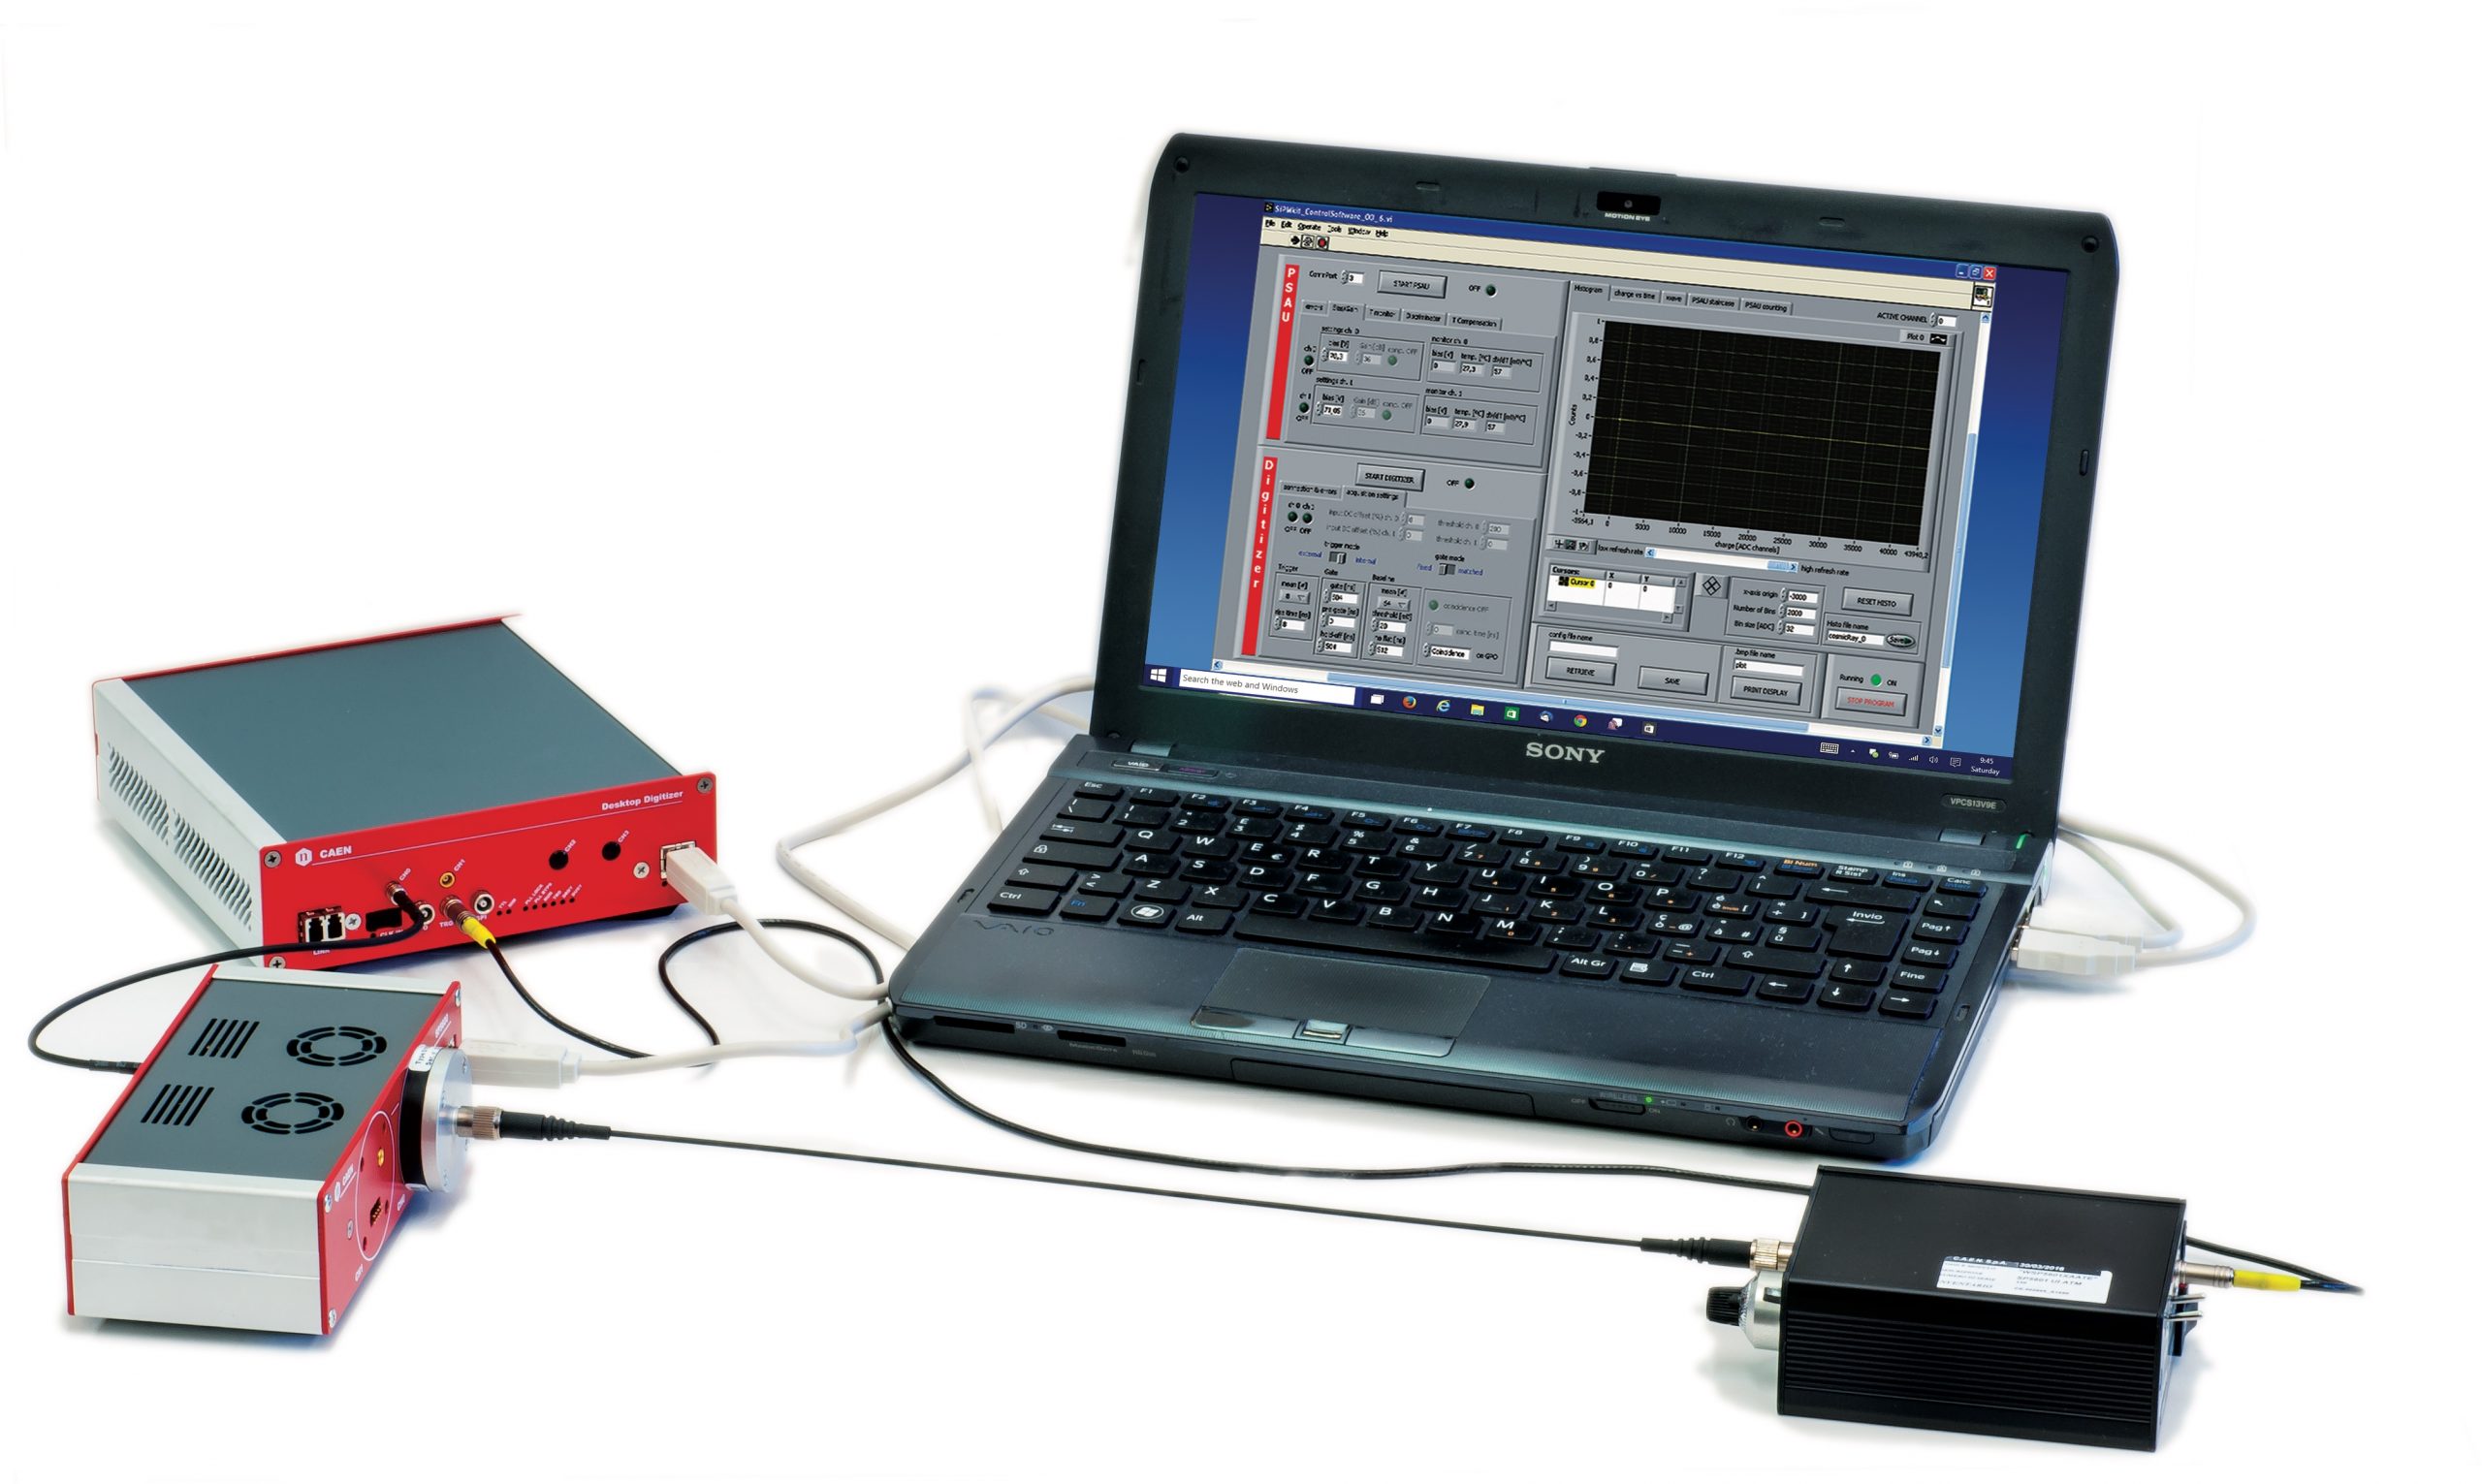
Hardware setup
This experiment guide is referred to the SP5600E educational kit.
Equipment: SP5600 – Educational Photon Kit
| Model | SP5600 | DT5720A | SP5601 | SP5650C |
|---|---|---|---|---|
| Description | Power Supply and Application Unit | Desktop Digitizer 250 MS/s |
LED Driver | Sensor Holder for SP5600 with SiPM |
Purpose of the experiment
Characterization of a SiPM detector using an ultra-fast pulsed LED.
Estimation of the main features of the detector at fixed bias voltage.
Fundamentals
Silicon Photomultipliers (SiPM) consist of a high‐density (up to ~104/mm^2) matrix of diodes connected in parallel on a common Si substrate. Each diode is an Avalanche Photo Diode (APD) operated in a limited Geiger‐Müller regime connected in series with a quenching resistor, in order to achieve gain at level of ~106. As a consequence, these detectors are sensitive to single photons (even at room temperature) feature a dynamic range well above 100 photons/burst and have a high Photon Detection Efficiency (PDE) up to 50%. SiPM measure the light intensity simply by the number of fired cells. However, this information is affected and biased by stochastic effects characteristic of the sensor and occurring within the time window: spurious avalanches due to thermally generated carriers (a.k.a. Dark Counts), delayed avalanches associated to the release of carriers trapped in metastable states (a.k.a. Afterpulses) and an excess of fired cells due to photons produced in the primary avalanche, travelling in Silicon and triggering neighboring cells (a phenomenon called Optical Cross Talk). The typical SiPM response to a light pulse is characterized by multiple traces, each one corresponds to different numbers of fired cells, proportional to the number of impinging photons. Because of the high gain compared to the noise level, the traces are well separated, providing a photon number resolved detection of the light field.
Carrying out the experiment
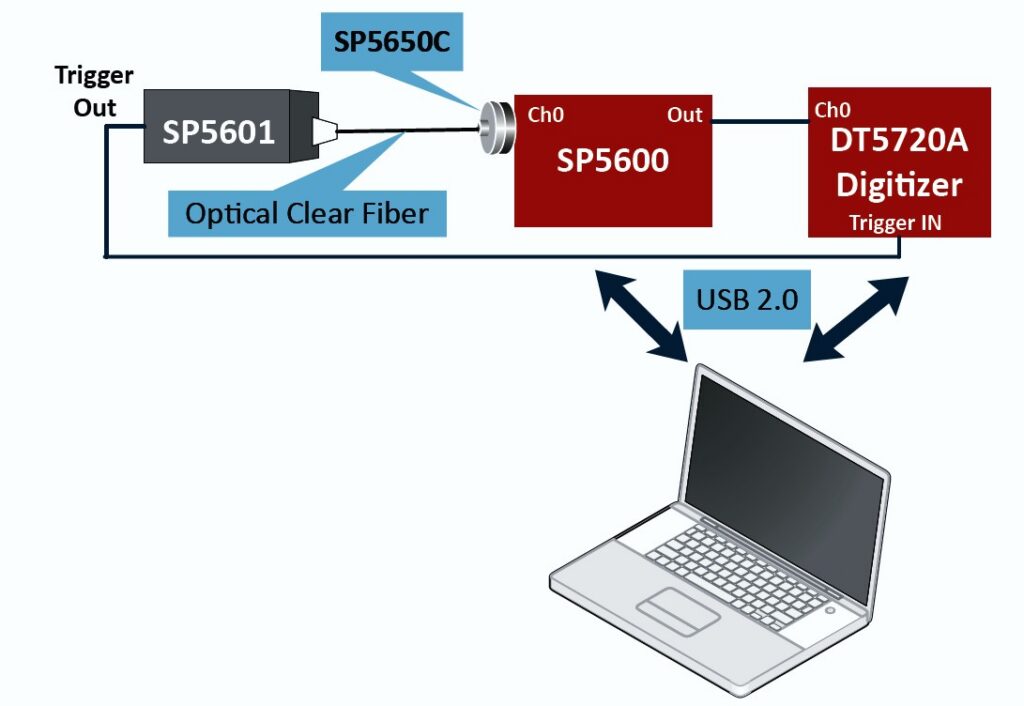
Experimental setup block diagram
The selected scintillator crystal shall be coupled to the SiPM in the SP5607, through a thin layer of index matching grease to maximize the light collection. In order to avoid saturation, the output of the SiPM is divided using the A315 splitter: one branch is connected to the DT5720A and will be digitized. The other branch will be amplified by the SP5600 module, generating the trigger for the integration signal by the on-board leading edge discriminator or simply counting the pulses induced by the detected gamma ray.
Results
The gain of the SiPM is evaluated from the output charge of the sensor. After the estimation of the ADC channel conversion factor (ADCc.r.) and the distance between adjacent peaks (ΔPP(ADC_ch), the SiPM gain can be calculated according to the following equation:
Gain = [ΔPP(ADC_ch) * ADCc.r.] / e
The resolution power of the system can be evaluated plotting the σ of each peaks versus the number of peaks. The counts frequency, in absence of light, at 0.5 p.e. threshold represents the DCR. The ratio between the dark count at 1.5 p.e. threshold (DCR1.5) and the value at 0.5 p.e. threshold (DCR0.5) give the crosstalk estimation of the detector.
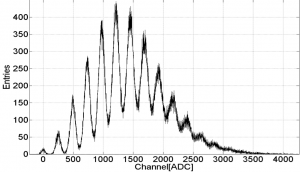
Spectrum of Hamamatsu S10362‐11‐100C.
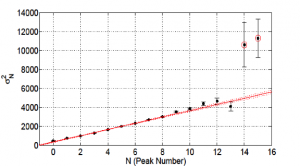
Peak σ versus peak number for Hamamatsu S10362‐11‐100C.
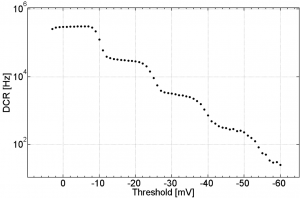
Sensor Dark Count frequency versus discrimination threshold