| Difficult | Execution Time | Data Analysis | Radioactive Sources |
|---|---|---|---|
| Yes | No |
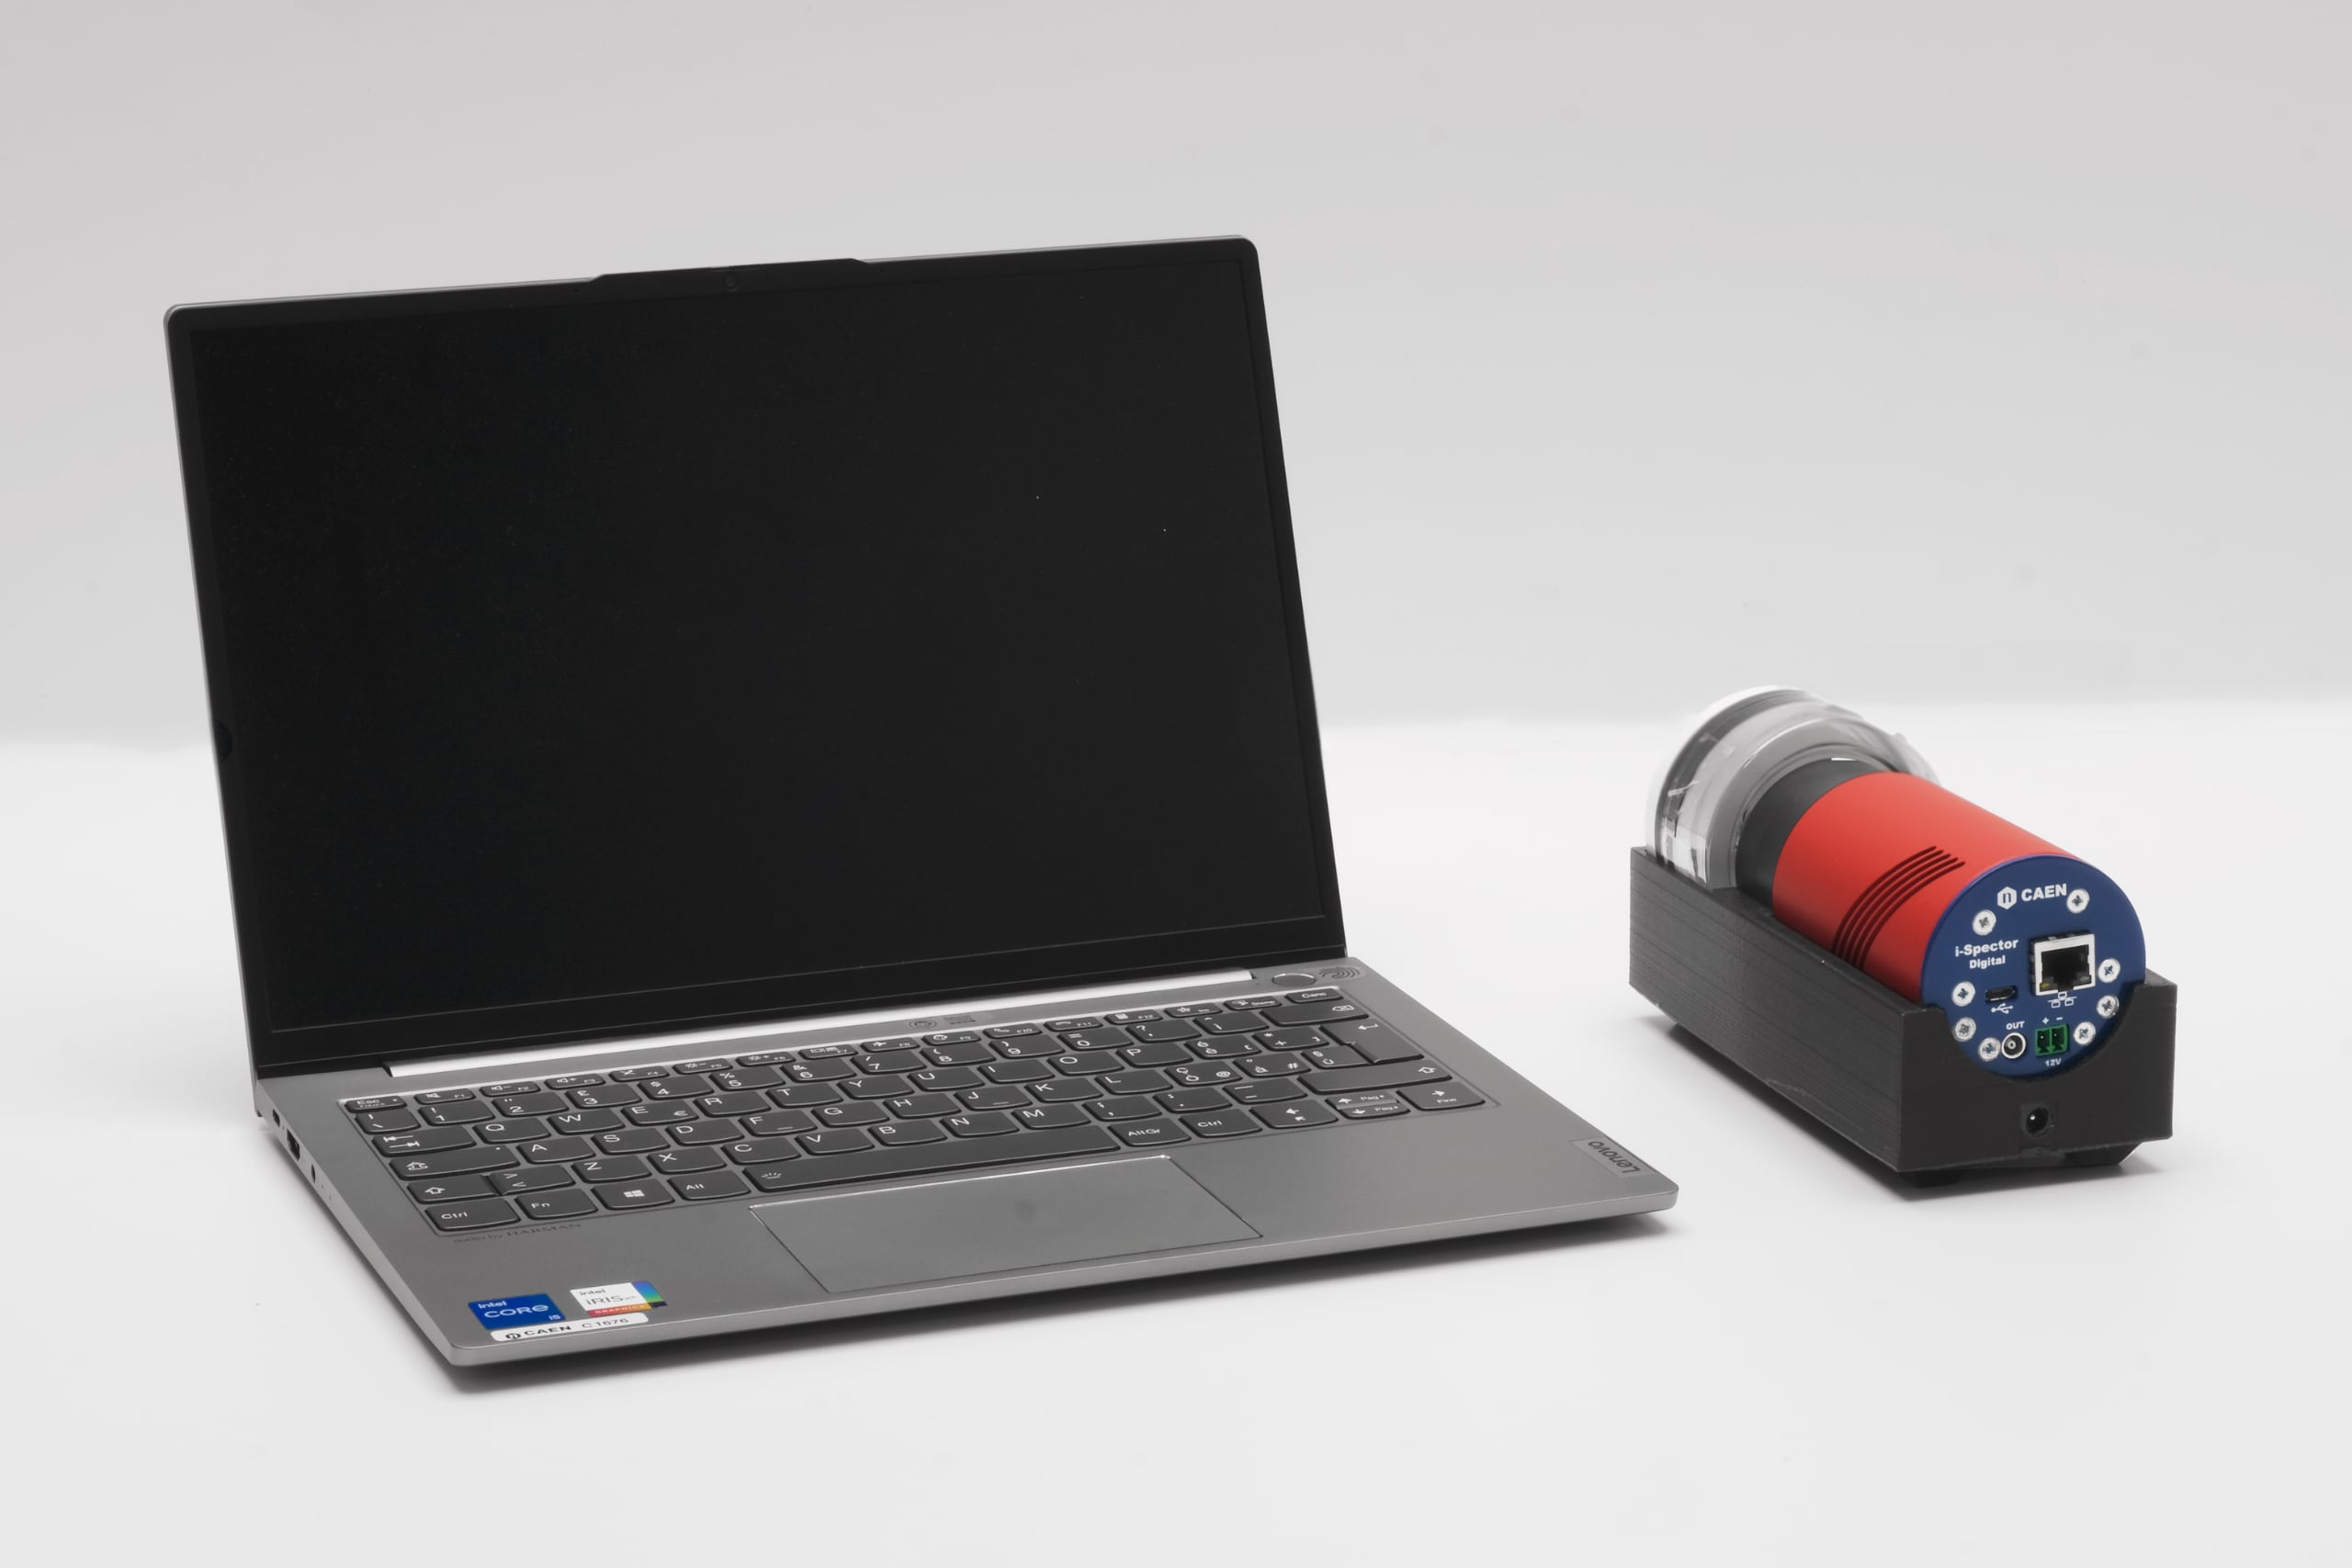
Hardware setup
This experiment guide is referred to the SP5630EN educational kit.
Equipment: SP5630EN – Environmental kit
| Model | i-Spector – S2570B | Samples |
|---|---|---|
| Description | Intelligent Silicon Photomultiplier Tube | Empty Beaker & Test Sample, Fertilizer and Rock, Canisters of Activated Carbon, Calibration Crystal |
Purpose of the experiment
Get familiar with radon passive measurements by taking care of the proper sample preparation and exposure, as well as of acquiring the spectrum to calculate the Radon concentration.
Fundamentals
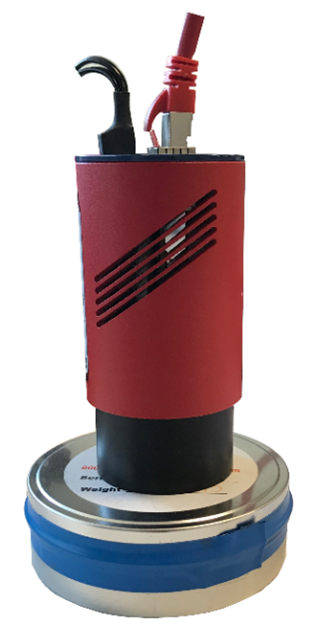
Experimental setup block diagram.
Radon is a naturally occurring radioactive gas produced by the breakdown of uranium in soil, rock, and water. Radon can be dangerous since it accumulates inside houses or buildings. Air pressure inside your home is usually lower than the pressure in the soil around the building foundation. Because of this difference in pressure, the building acts like a vacuum, drawing radon in through foundation cracks and other openings. Additionally, building materials — such as granite and certain concrete products — can give off radon.
It is usually recommended to make screening measurements to have a quick estimate of the highest concentration and take action in case the measurement exceeds 4 pCi/L (or 100 Bq/m3), which is the limit for a non-dangerous exposure to this element.
Carrying out the experiment
Detailed instructions for this activity are reported in Sec. Appendix A: Radon measurement. Check the expiration date of the charcoal sample; if expired, or if the sample has already been used, bake it for some hours. Acquire the background spectrum with the i-Spector. Before starting the acquisition, make sure that the temperature is stable from the web interface. Once done, expose the sample for about 5-6 days, following the requirements of the closed house, and far away from wall, windows, etc., according to the Radon measurement procedure. Once ready, seal again the sample, wait at least three hours, and acquire the energy spectrum. Take few hours of acquisition with the exposed sample in the same condition of background acquisition.
Results
After the energy calibration and background subtraction, it is possible to select the region of interest (ROI) of the 214Pb and 214Bi decay products at 295 keV, 352 keV, and 609 keV. The counts can be used together with the calibration curves to calculate the Radon concentration. On request, Excel® spreadsheets examples can be provided to customers.
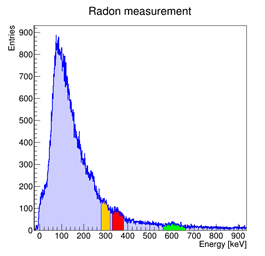
Radon spectrum: counts of the three ROI are summed and combined with the calibration curves. The result is 124 ± 85 Bq/m3. Longer acquisition time will improve the measurement resolution.