| Difficult | Execution Time | Data Analysis | Radioactive Sources |
|---|---|---|---|
| Yes | No |
Hardware setup
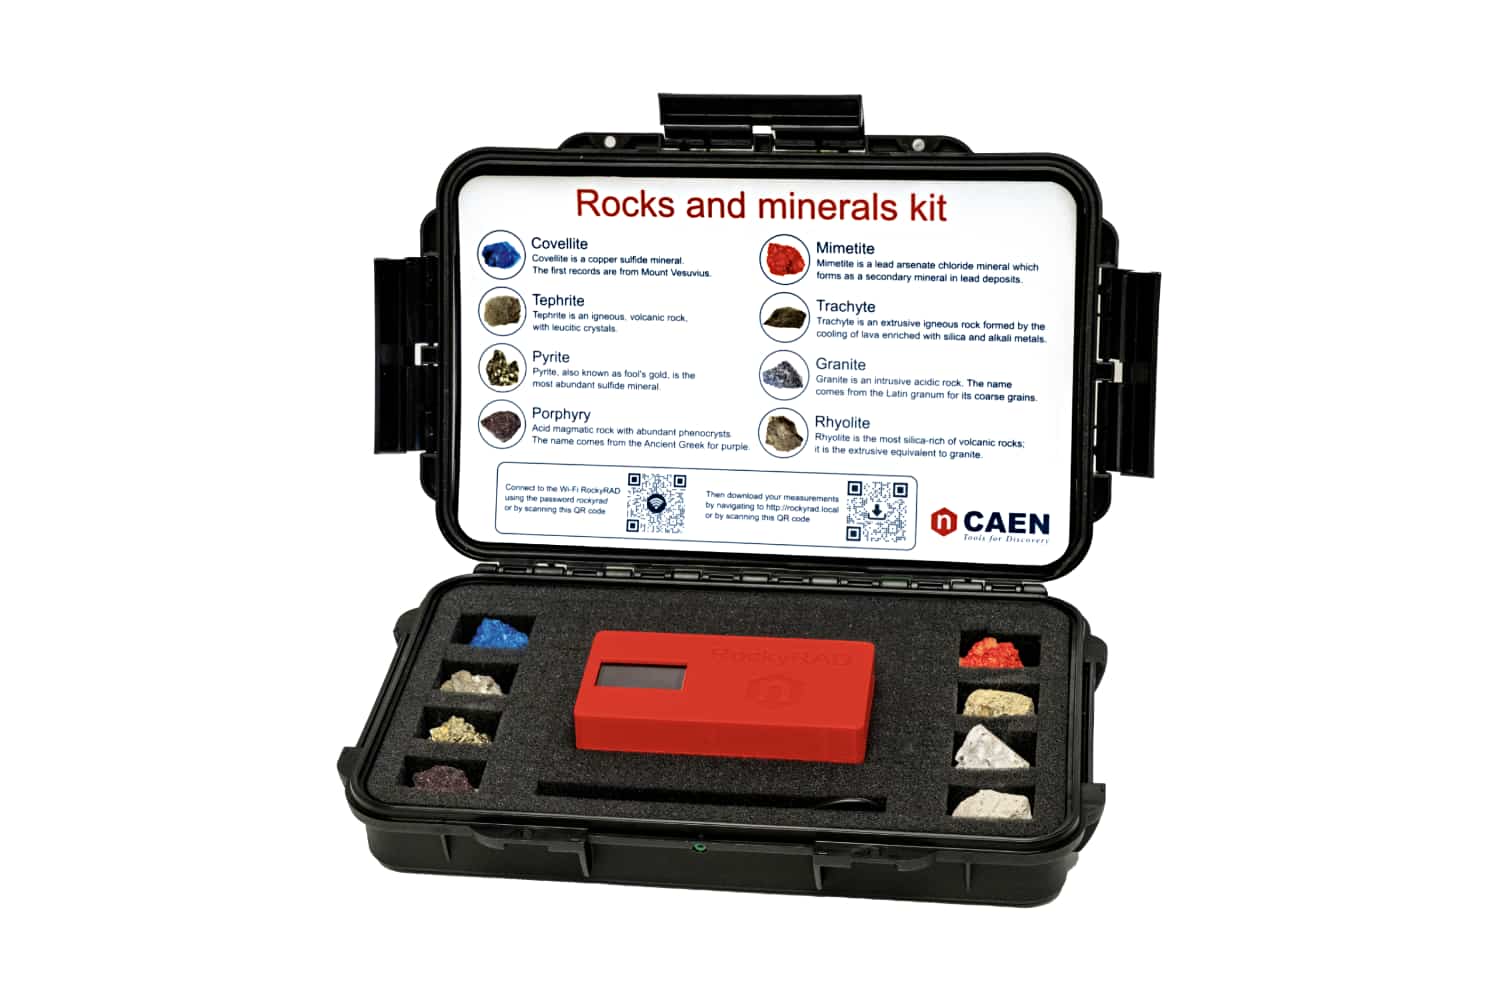
This experiment guide is referred to the SP5660 Educational Kit.
Equipment: SP5660 – RockyRAD
| Model | SP5660 |
|---|---|
| Description | RockyRAD |
Purpose of the experiment
Study of relationship between uncertainty analysis and the duration of data acquisition.
Fundamentals

Experimental setup block diagram
In the experimental Physics field, the accurate assessment of uncertainties is paramount to ensure the reliability and precision of measurements. Measurement, an essential aspect of scientific inquiry, inherently involves some degree of uncertainty. Uncertainty refers to the range within which the true value of a physical quantity is expected to lie. Two key dimensions of uncertainty are relative uncertainty and absolute uncertainty. Relative uncertainty, often expressed as a percentage, gauges the precision of a measurement in relation to the size of the measured quantity. It is calculated by dividing the absolute uncertainty by the measured value and multiplying by 100. Absolute uncertainty is the quantitative measure of the range within which the true value of a measured quantity is expected to lie. It is typically expressed in the same units as the measured quantity. The determination of absolute uncertainty involves considering various factors, including instrumental limitations and experimental procedures. Live time, as a parameter in this experiment, represents the duration for which data is actively collected. By systematically varying the live time during measurements, we aim to observe the influence of this temporal factor on both relative and absolute uncertainties. The statistical nature of measurements becomes apparent as we analyze how uncertainties change as a function of live time.
Carrying out the experiment
- The experiment involves several data-taking with different acquisition time.
- Begin by placing the GM detector on the desk and powering on the system. The experiment could be performed with or without a rock sample.
- GM detector will immediately initiate measurements and record data every minute during acquisition.
- The detected particles are counted and displayed on the monitor (CNTS), along with the average counts per minute (CPM) and dose (nSv/h).
- The system produces a sound for each detection.
Results
The experiment explores how the relative uncertainty evolves with varying live times, providing insights into the impact of data acquisition duration on the precision of our measurements. This experiment not only provides valuable insights into the statistical aspects of measurements but also sheds light on the dynamic relationship between uncertainty and the temporal dimension of data acquisition.

Relative uncertainty as a function of the live time.
| T [min] | σREL [%] | σASS [cpm] |
|---|---|---|
| 1 | 21 | 4.7 |
| 5 | 10 | 2.1 |
| 15 | 6 | 1.2 |
| 30 | 4 | 0.9 |
| 60 | 3 | 0.6 |
| 120 | 2 | 0.4 |