| Difficult | Execution Time | Data Analysis | Radioactive Sources |
|---|---|---|---|
| Yes | Yes |
Hardware setup
This experiment guide is referred to the SP5600C educational kit. If you don’t have this kit, choose your own from the following list to visualize the related experiment guide: SG6112B, SG6112C, SG6112E – Educational Kit
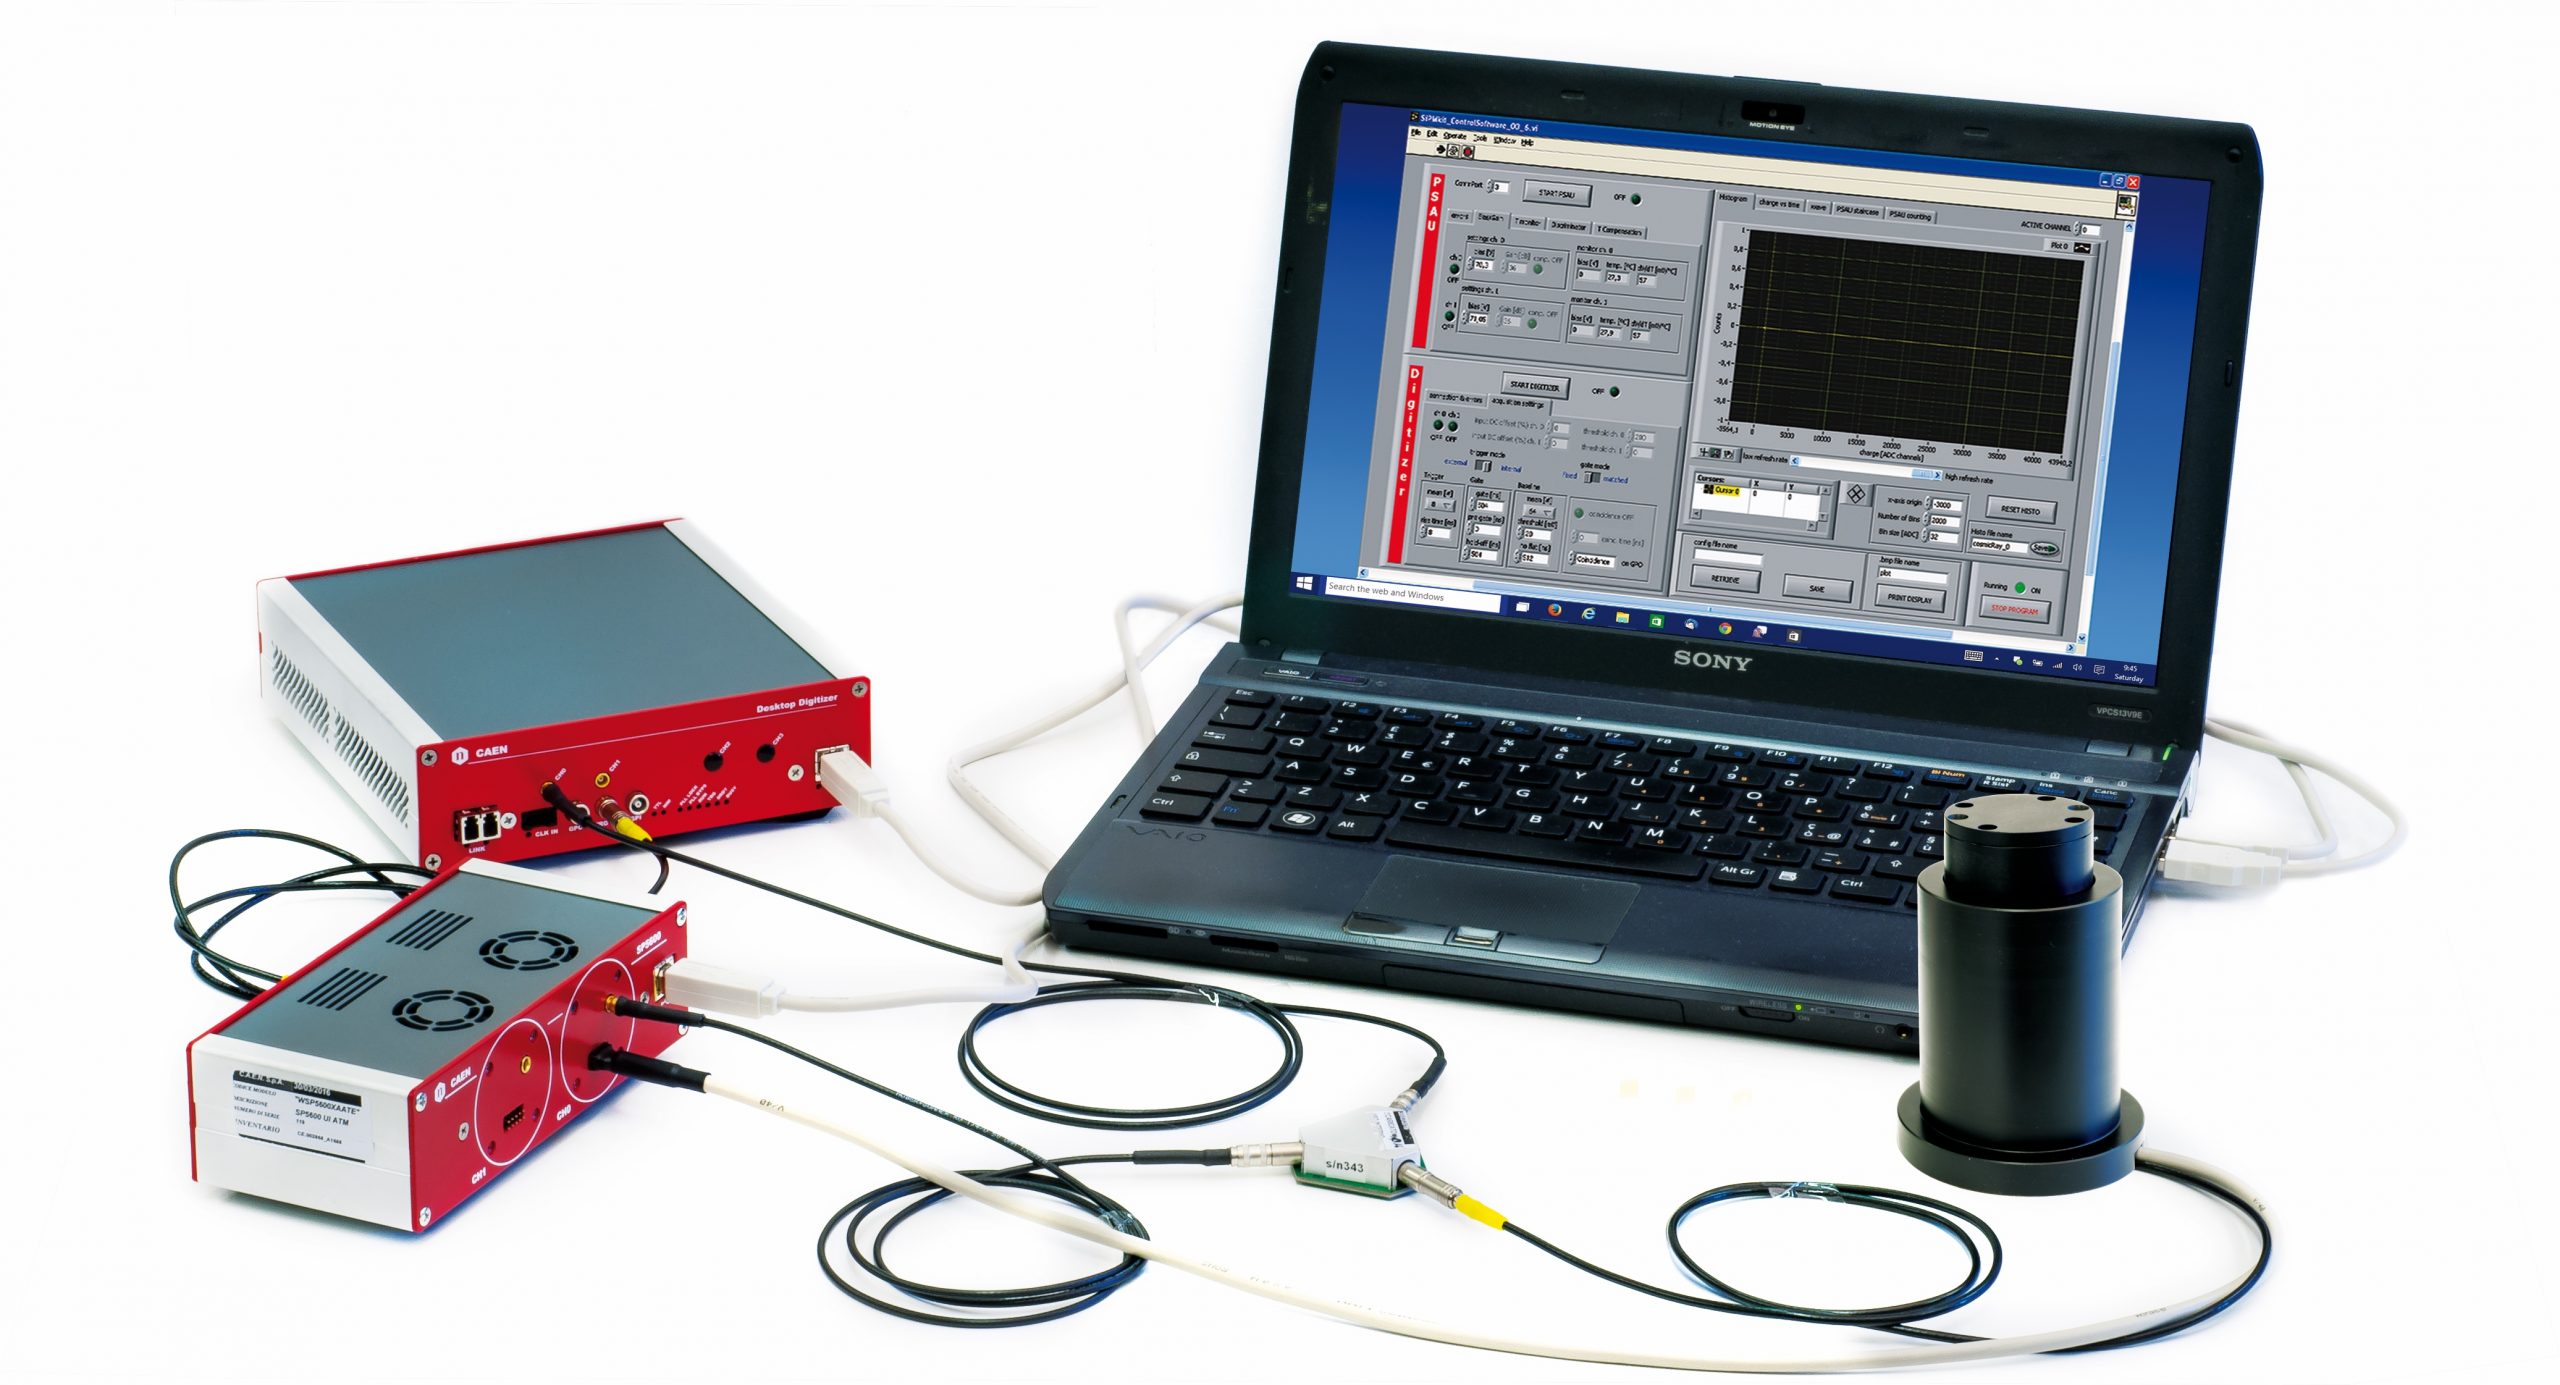
Equipment: SP5600C – Educational Gamma Kit
| Model | SP5600 | DT5720A | A315 | SP5606 | SP5607 | Additional Tool |
|---|---|---|---|---|---|---|
| Description | Power Supply and Amplification Unit | Desktop Digitizer 250 MS/s | Splitter | Mini Spectrometer | Absorption Tool | Gamma Radioactive Source |
Purpose of the experiment
Study the statistical distribution of the counting rates of a gamma radioactive source. Comparison of the data to the Poisson distribution, turning into a Gaussian as the mean number of counts grows. The study can be performed both experimentally, with the SiPM kit or simulating it with the emulation kit.
Fundamentals
The number of radioactive particles detected over a time Δt is expected to follow a Poisson distribution with mean value μ. It means that for a given radioactive source, the probability that n decays will occur over a given time period Δt is given by:
Pμ(n) =μn⁄n! e-μ
Where μ is proportional to the sample size and to the time Δt and inversely proportional to the half-life T1/2 of the unstable nucleus. As long as μ grows, the probability P μ (n) is well approximated by a Gaussian distribution:
P(n) =1⁄√(2πσ) e-(n – μ)2 / (2σ2)
Where σ = √μ is the standard deviation.
Carrying out the experiment
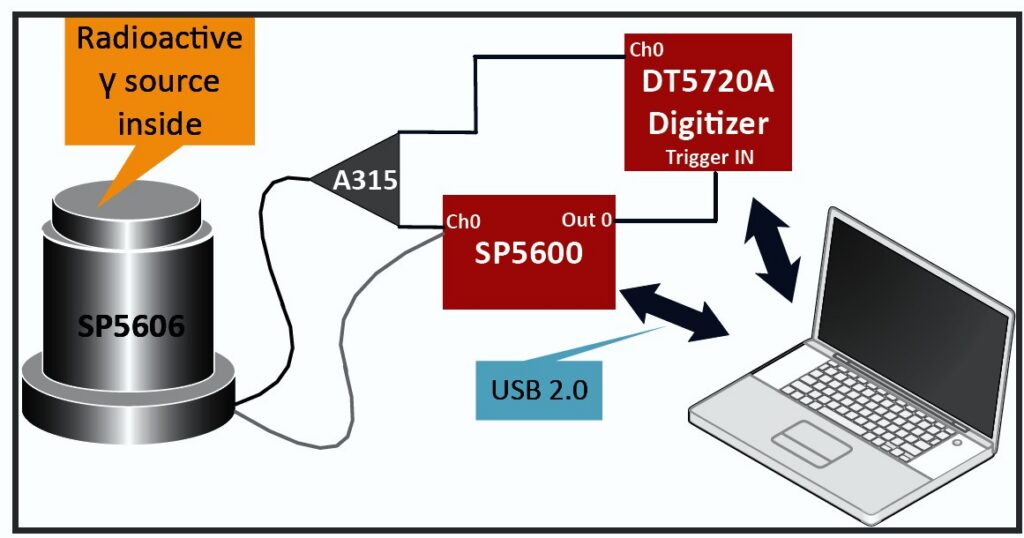
Block diagram of the experimental setup that makes us of the “Educational Gamma Kit”
The selected scintillator crystal shall be coupled to the SiPM in the SP5607, through a thin layer of index matching grease to maximize the light collection. In order to avoid saturation, the output of the SiPM is divided using the A315 splitter: one branch is connected to the DT5720A and will be digitized. The other branch will be amplified by the SP5600 module, generating the trigger for the integration signal by the on-board leading edge discriminator or simply counting the pulses induced by the detected gamma ray. The discriminator threshold shall be defined looking at the spectrum and evaluating the dark count rate. Once this is properly set, the counting experiment shall be performed.
Results
Changing the counting window and/or the activity of the source or the threshold, the number of counts changes, with a probability density function moving form a Poissonian to a Gaussian shape. The student may play with the data, fitting them and comparing the expectations to the measurement.
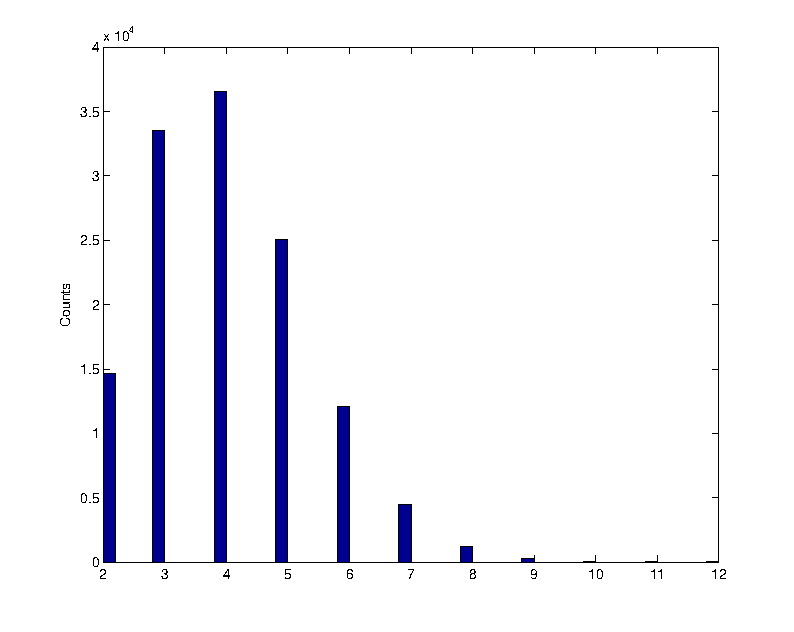
Poissonian distribution
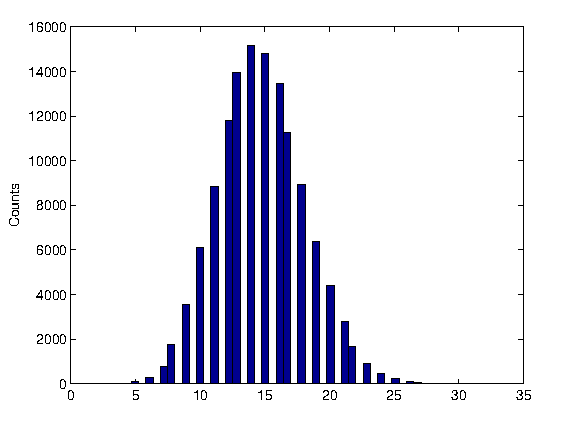
Gaussian distribution