| Difficult | Execution Time | Data Analysis | Radioactive Sources |
|---|---|---|---|
| Yes | No |
Hardware setup
This experiment guide is referred to the SP5640 educational kit.
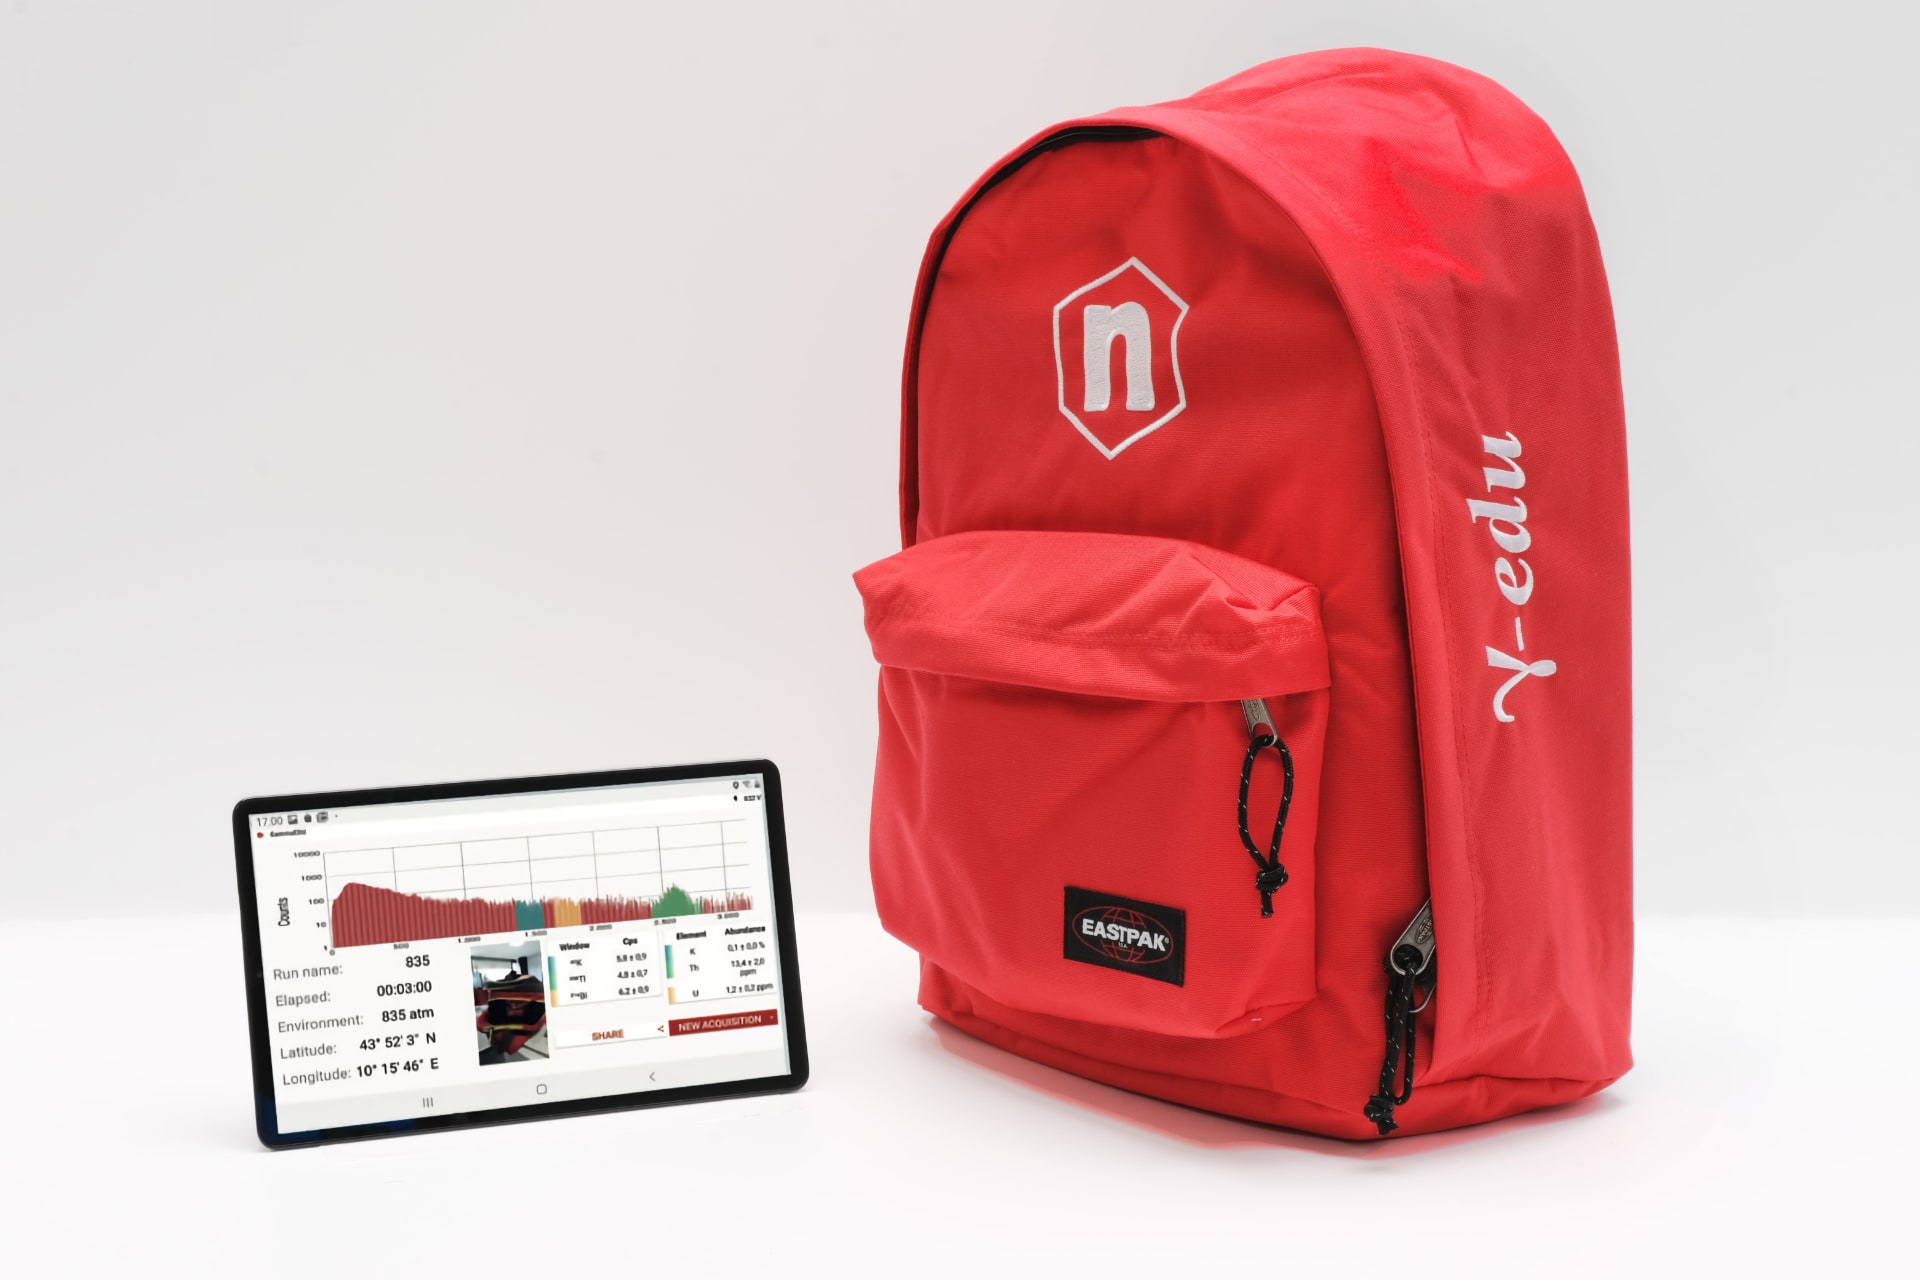
Equipment: SP5640 – Backpack Detector
| Model | SP5640 |
|---|---|
| Description | Backpack Detector |
Purpose of the experiment
Starting from outdoor spectroscopy measurements to create the map of the natural radioactivity expressed in total specific activity in Bq/kg of the investigated area.
Fundamentals
The human population is continuously exposed to ionizing radiation from various natural sources (cosmic and terrestrial ones). Moreover, the exposure to natural sources exceeds that of all artificial, i.e., due to medical use, power generation and associated fuel cycle facilities, radioisotope production waste management and from military ones. In this context, the radiological monitoring of the geographical areas became very important. All over the World, several institutions are missioned to develop collections of maps showing the levels of natural radioactivity caused by different sources (e.g., indoor radon, cosmic radiation, terrestrial gamma radiation, and natural radionuclides in soil and bedrock).
Requirements
No other tool is needed.
Carrying out the experiment
- Power on the γstream inside the red backpack.
- Power on the tablet and associate the two devices via Bluetooth.
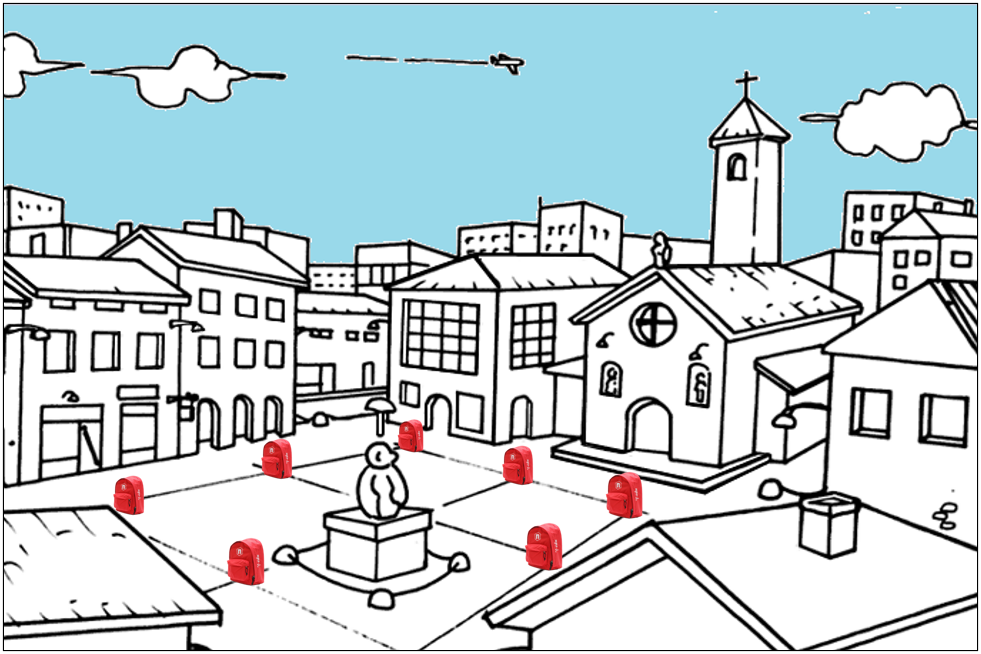
- Take care that the γstream internal battery is charged, otherwise use the external power system. The in-situ survey must be planned to keep in mind the spatial resolution of the desired information: it is important choosing the sampling points in order to cover the surveyed area comprehensively for the different types of ground coverage, like asphalt, grass, or brick.
- Start the measurement campaign and place the backpack on the floor almost 1m far from the buildings, manhole or other construction.
- Set the acquisition time to about 5 minutes and see the results. If the statistic is not enough increasing the acquisition time.
Results
The results that were obtained during the outdoor experiment in terms of total activity originating from 40K, 238U, and 232Th are visualized via Google Earth. From these data, a natural radioactivity map of the investigated area can be developed.
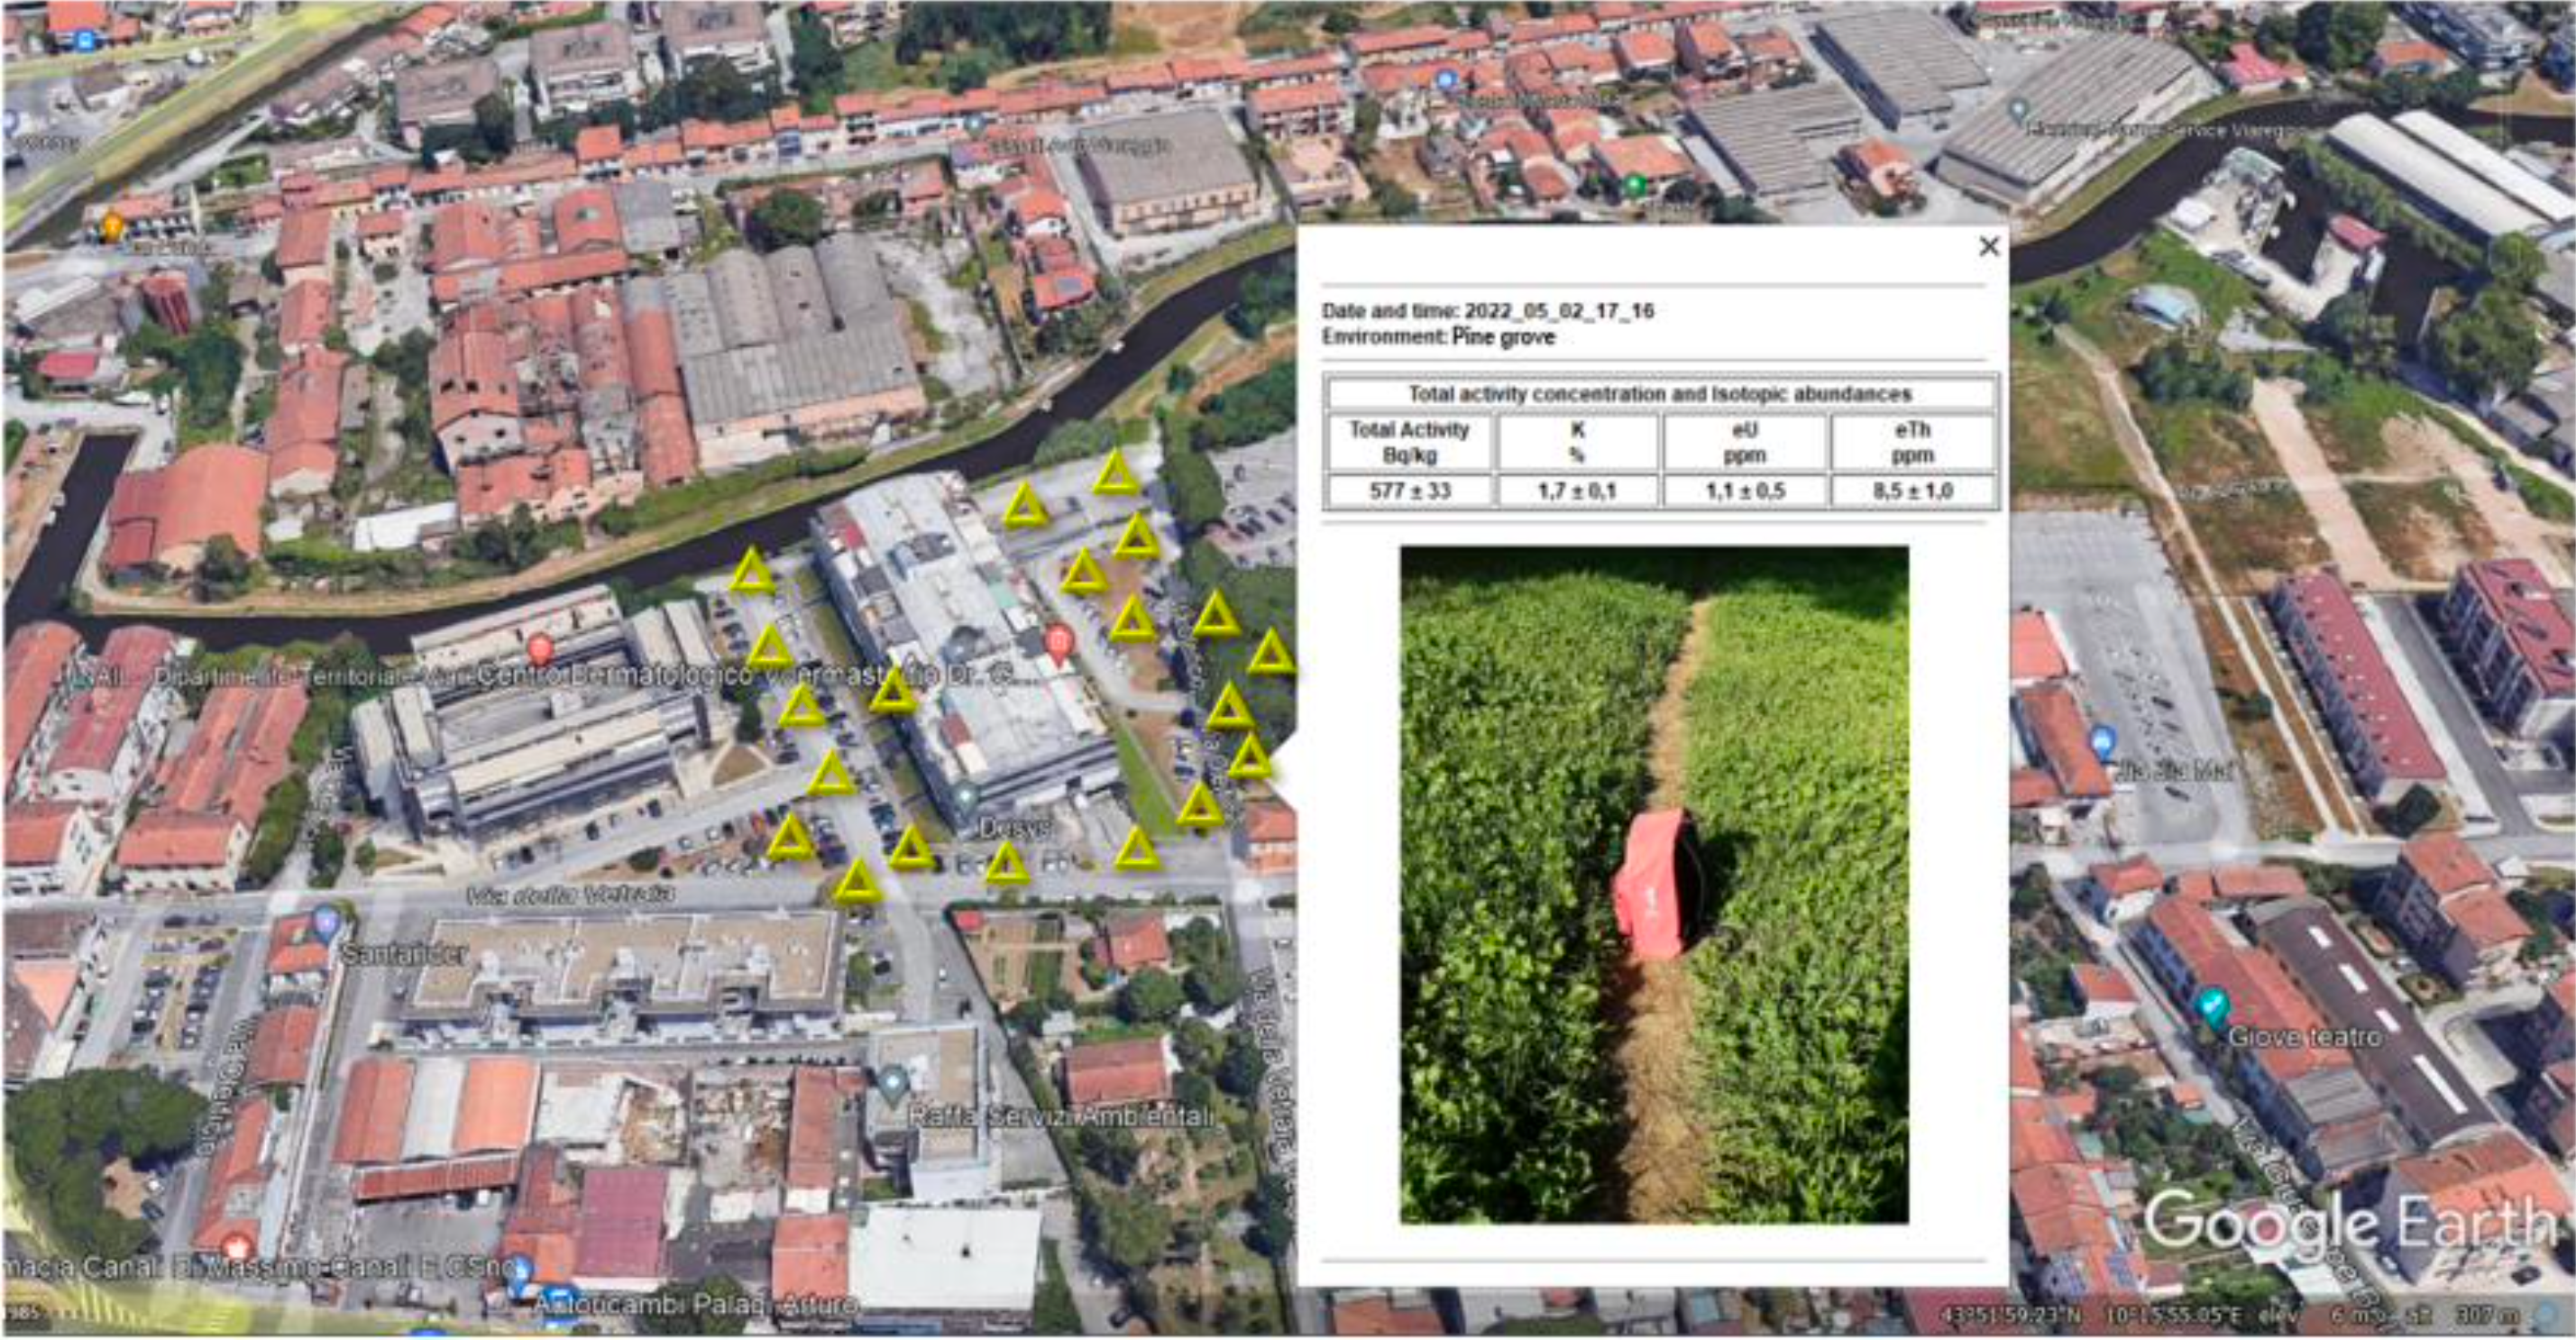
Maps of the measurement points (yellow triangles) reported in the Google Earth app and the example of the measurement result reporting total activity concentration and Isotopic abundances [Viareggio, Italy].