| Difficult | Execution Time | Data Analysis | Radioactive Sources |
|---|---|---|---|
| Yes | No |
Purpose of the experiment
This activity shows how to compare different spectra together.
Fundamentals
Spectra comparison is a very common procedure in statistics and physics and consist of the superposition of different spectra, taken in the same conditions, or normalized to a common state. For example, radioactive sample and background spectra can be superimposed to visually show the differences and highlight the signal contribution.
Different sample spectra can be superimposed too, like for example the Soil and Fertilizer samples to see how in the same amount of time the two samples emitted. In the case of comparison of radioactive samples with a big activity difference, the normalization could be done for the total number of events.
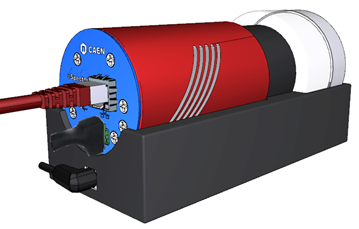
Another possible comparison is by using a different detector, like the High Purity Germanium detector (HPGe), or a different system, like the GammaEDU backpack SP5640, composed of photomultiplier tube (PMT) coupled to a NaI scintillating crystal (0,3L).
Requirements
No other tool is needed.
Experimental setup block diagram
Carrying out the experiment
Put the i-Spector digital into the base and place the Soil box into the place-holder. Power on the i-Spector and connect the Ethernet cable. Wait until the temperature is stable from the web interface (it can take half an hour from power on).
Check the waveform, modify the threshold and gate width, if needed, then start the measurement of the energy spectrum.
Take 30 minutes acquisition with the Soil sample and then repeat the measurement by using Fertilizer sample.
NOTE: Settings and acquisition time must be the same. Lead blocks could help in distinguish clearer peaks but they must be used if just employed in background measurement only.
Results
Superimpose the Fertilizer and Soil spectra in the same histogram. The different contributions are clearly visible on the left plot below, where the Uranium and Thorium peaks are visible in the region 200-400 keV of the Soil sample, while no contribution appears in the Fertilizer sample, and viceversa, the 40K peak with its Compton edge is visible in the Fertilizer sample, with no contribution in other energy areas.
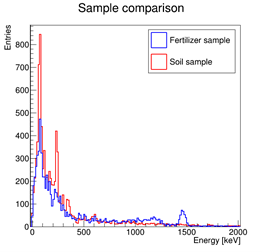
Sample comparison: two samples taken with the same i-Spector in the same experimental conditions.