| Difficult | Execution Time | Data Analysis | Radioactive Sources |
|---|---|---|---|
  |
  |
Yes | No |
Purpose of the experiment
The aim of this experiment is to demonstrate how a Python application can be used to acquire and visualize waveforms in real time from an FPGA-based system.
Fundamentals
In many detector readout systems, it is important not only to detect events but also to observe and analyze the full waveform produced by the detector. The shape of a pulse can provide valuable information about the signal amplitude, timing characteristics, noise conditions, and overall system performance. In digital data acquisition systems, the analog signal is first sampled by an Analog-to-Digital Converter (ADC). The resulting sequence of samples represents the waveform in the time domain and can be processed or transmitted to a computer for visualization and analysis. Modern FPGA-based systems often include dedicated waveform buffers, where a set of consecutive samples is stored. These samples can then be transferred to a PC through a communication interface and displayed using software tools.
In this experiment, waveform data generated by the FPGA firmware are acquired by a Python application and plotted in real time using a graphical visualization library. This allows users to observe the signal evolution sample by sample and better understand how the detector and the readout electronics behave during operation.
Requirements
Python environment and Matplotlib for plotting.
Carrying out the experiment
A Python program is used to connect to the hardware and read waveform data generated by the FPGA firmware. The program performs the following steps:
- establishes communication with the board,
- requests waveform samples from the firmware buffer,
- converts the acquired data into a format suitable for visualization,
- displays the waveform using a real-time plotting interface.
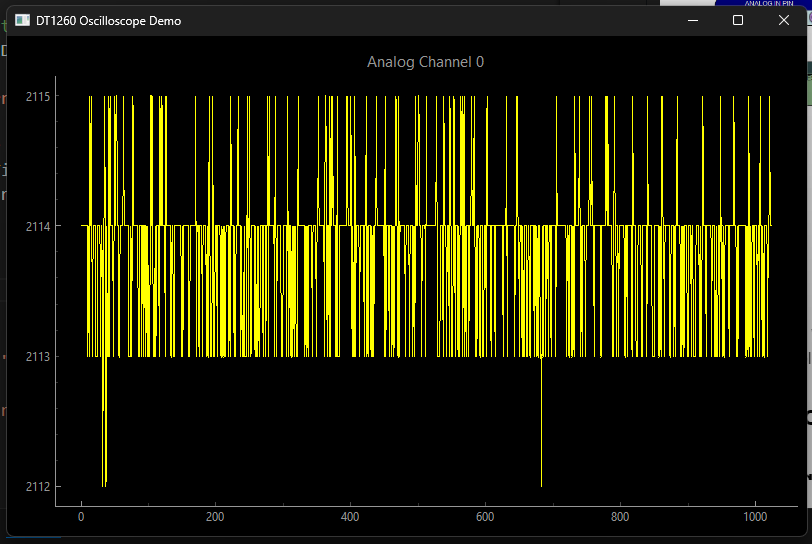
As signals are applied to the input, the acquired samples are continuously updated in the graphical display.
Results
The system acquires waveform samples from the hardware and displays them in real time. Students can observe the shape and amplitude of the signal and how the waveform changes with different input conditions. This experiment demonstrates how software tools can be used to visualize detector signals in digital readout systems.