| Difficult | Execution Time | Data Analysis | Radioactive Sources |
|---|---|---|---|
  |
  |
Yes | No |
Purpose of the experiment
The aim of this experiment is to show how a Python program can read and display two histograms produced by the FPGA firmware: the Time-over-Threshold (ToT) spectrum and the Time-of-Flight (ToF) spectrum. Students learn how software can be used to collect, visualize, and compare timing-related measurements from the same acquisition system.
Fundamentals
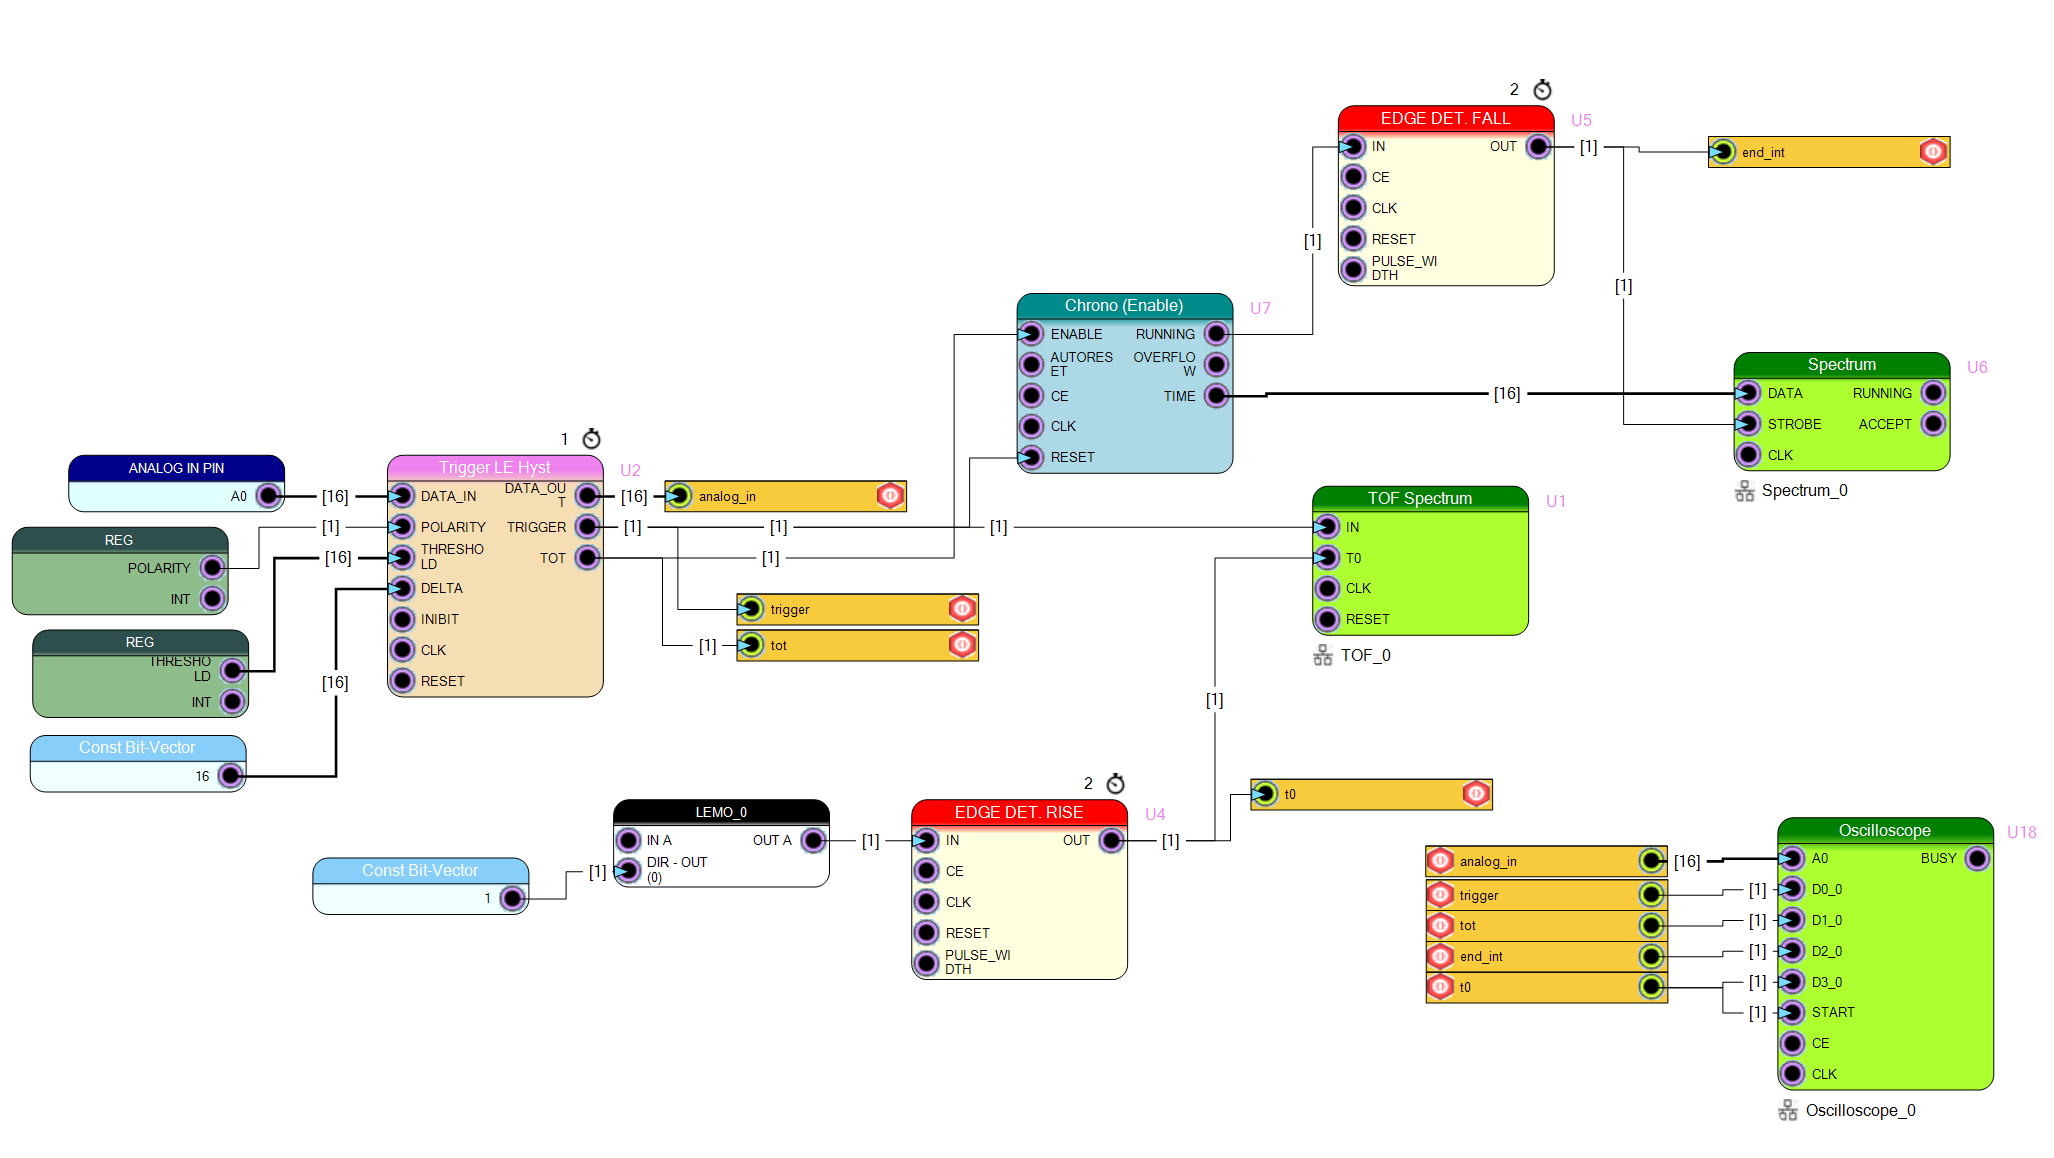
In digital readout systems, measured quantities such as ToT and ToF can be accumulated into spectra, where each bin stores the number of events corresponding to a given measured value. A ToT spectrum shows how long signals remain above threshold, while a ToF spectrum shows the time delay between a reference signal and the detected event. Plotting these two histograms helps users study both pulse timing and pulse-related amplitude information in a simple visual form. In this lab, the firmware inherited from ID.6308 includes two histogram blocks, one for ToT and one for ToF, and both can be read from Python and plotted side by side.
Requirements
Python environment and Matplotlib for plotting.
Carrying out the experiment
A Python script connects to the DT1260, configures the two spectrum components, resets their memories, and starts data accumulation. After a fixed acquisition time, the program reads both histograms from the FPGA memory and plots them in two side-by-side graphs: one for ToT and one for ToF. This allows students to visualize the distribution of the measured values directly from software.
Results
The experiment produces two spectra displayed side by side: a ToT histogram and a ToF histogram. The ToT spectrum shows the distribution of pulse durations above threshold, while the ToF spectrum shows the distribution of time delays between the reference and the detected signal. By observing the position and shape of the peaks, students can evaluate the timing behaviour of the system and relate the two measurements to the characteristics of the input pulses.