| Difficult | Execution Time | Data Analysis | Radioactive Sources |
|---|---|---|---|
 |
 |
Yes | No |
Purpose of the experiment
This experiment introduces the students to the concept of pulse shape discrimination (PSD), a technique used to distinguish different types of signals based on their shape.
Fundamentals
In some detectors, different types of radiation or particles produce pulses with different shapes, even when their amplitudes are similar. By analysing the shape of the pulse, it is possible to distinguish between different types of events. One common PSD technique is based on the ratio between the pulse amplitude (peak value) and the pulse area (integrated charge). Since different signals may have different rise and decay times, this ratio can be used as a parameter to separate event populations. In digital readout systems, both amplitude and charge can be calculated from the sampled waveform. The FPGA can then compute the amplitude-to-area ratio for each event and use this value to perform event classification or generate PSD plots.
Requirements
Python environment.
Carrying out the experiment
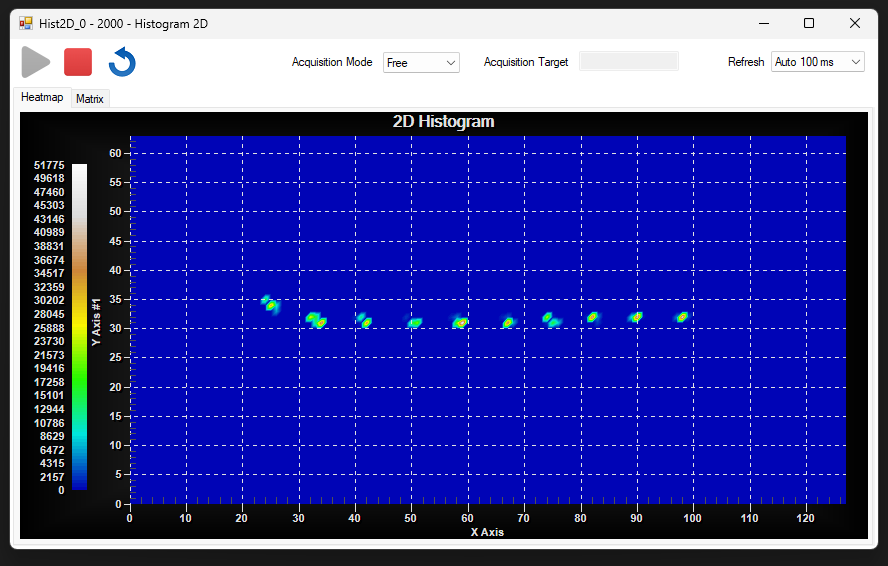
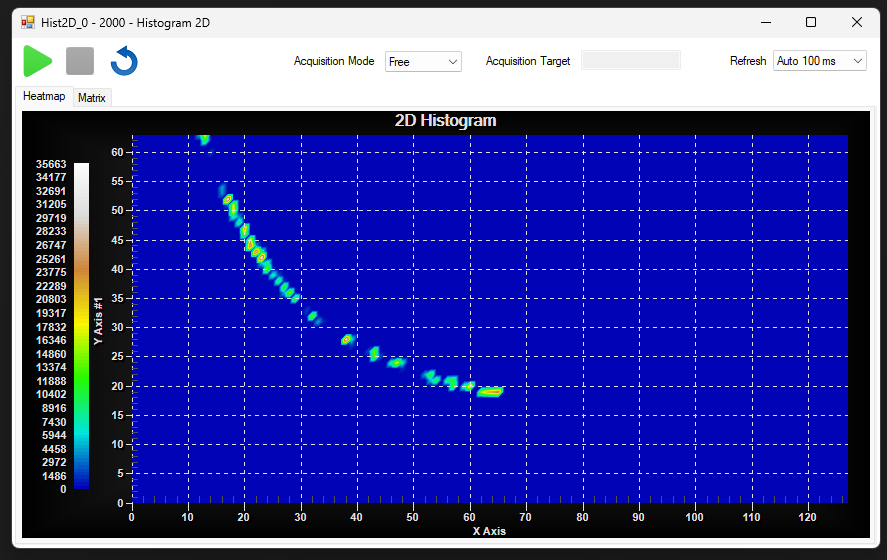
Create a project for your DT1260 unit: press New Project. A firmware design is implemented including: a trigger block to detect incoming pulses, a peak detection module to measure pulse amplitude, a charge integration module to measure pulse area, and a processing block that calculates the amplitude-to-area ratio. For each detected event, the FPGA computes the amplitude and the integrated charge and then evaluates their ratio. After compiling the design and programming the DT1260 board, the system can be tested using the DT4800 connected to the DT1260 analog input. The resulting values can be read and plotted using the control software.
Results
This experiment demonstrates how pulse shape discrimination techniques can be implemented in FPGA-based readout systems to distinguish between different types of signals based on their waveform characteristics.