
| Difficult | Execution Time | Data Analysis | Radioactive Sources |
|---|---|---|---|
  |
  |
Yes | Gamma |
Hardware setup
This experiment guide is referred to the SP5630ENP educational kit. If you don’t have this kit, choose your own from the following list to visualize the related experiment guide: SG6119B – Educational Kit.
Equipment: SP5630ENP – Backpack Detector
| Model | SP5630ENP | Additional Tool |
|---|---|---|
| Description | Gamma Radiation and Shielding Laboratory | Additional Gamma Radioactive Source  |
Purpose of the experiment
Determine the activity of a 60Co source from its γ-spectrum. Learn about the meaning of the sum peak, visible in the spectrum of some radioactive sources.
Fundamentals
The 60Co spectrum presents two distinct gamma photopeak in its spectrum, respectively corresponding to photons γ1 and γ2 at 1.17 MeV and 1.33 MeV. For the purpose of this experiment, we can assume that each of these gamma rays are isotropically distributed. In other words, if γ1 departs in a particular direction, γ2 can go in any direction that it wishes. There is a certain probability that γ2 will go in the same direction as γ1. If this occurs the energies of γ1 and γ2 will be summed in the detector. Hence a sum peak will show up in the spectrum, at nearly 2.5 MeV.
We can estimate the activity of the source by calculating the counts under the two main peaks and under the sum peak, i.e. calculating their area ∑. For the case of 60Co, we have that the counts under the sum peak can be evaluated as
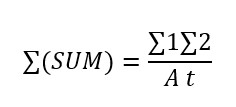
Where A is the activity of the source and t is the acquisition time. Therefore, fitting the peaks with a gaussian and calculating their area, it is possible to estimate the activity of the 60Co source used to record the available spectrum.
Carrying out the experiment
Place the i-Spector Digital into the base and the ¹³⁷Cs source in the dedicated source holder. Power on the i-Spector Digital and connect the Ethernet cable, then wait until the detector temperature is stable, as shown in the web interface: this can take up to half an hour after power-on.
Check the waveform and, if needed, adjust the trigger threshold and the gate width. Then start the acquisition of the energy spectrum, for example for 5 minutes. In the acquired spectrum, identify the main features of 60Co: the photopeaks at at 1.17 MeV and 1.33 MeV and the sum peak at nearly 2.5 MeV. Finally, select a ROIs around the photopeaks and check the values reported in the ROIs fit, such as the peak position, the FWHM, the energy resolution and the net counts.
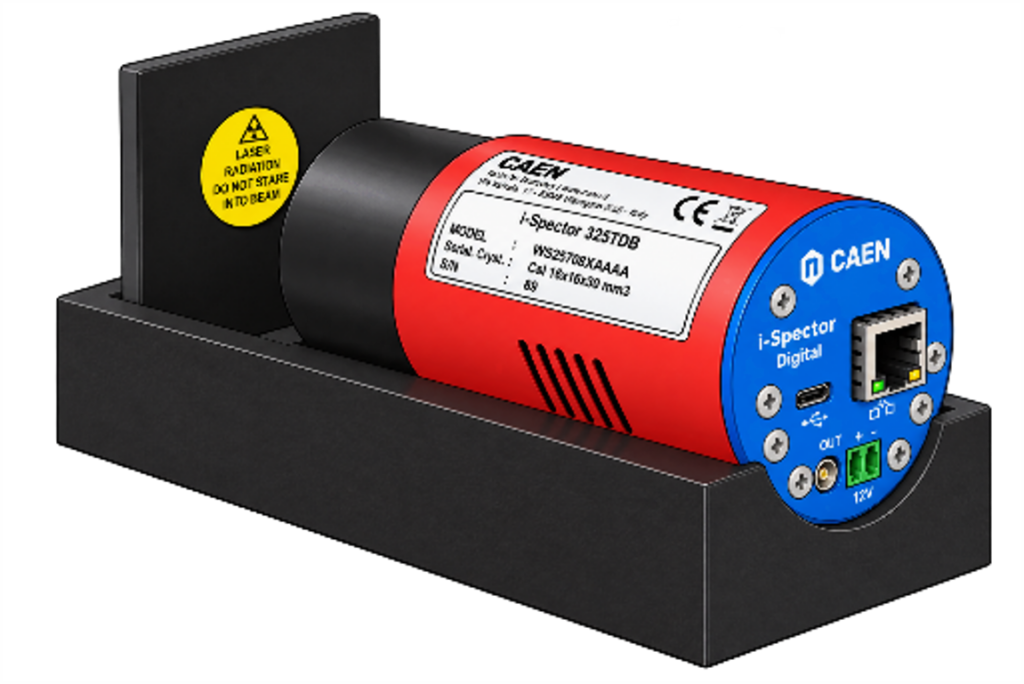
Experimental setup.
Results
The user should verify that, after the spectrum calibration, the sum peak is nearly at 2.5 MeV. From the formula given above, using the live time in seconds, the student can estimate de activity of 60Co directly in Bq. A calculation made for a spectrum acquired in 100 seconds gives an activity of nearly 264 kBq.
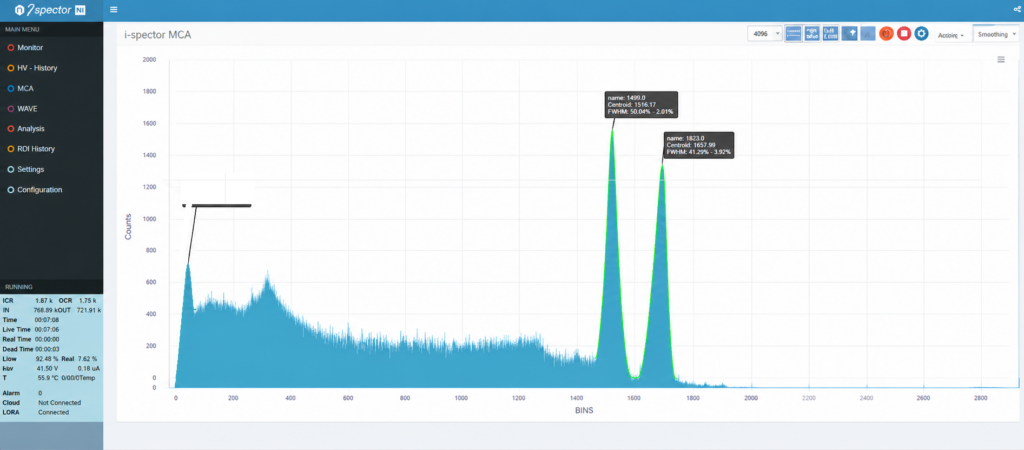
The 60Co complete spectrum acquired by i-Spector Web interface.