| Difficult | Execution Time | Data Analysis | Radioactive Sources |
|---|---|---|---|
  |
  |
Yes | No |
Purpose of the experiment
The aim of this experiment is to demonstrate how event data acquired in list mode can be read, decoded, and analyzed using a Python application.
Fundamentals
In digital data acquisition systems, measurements can be stored as list data, where each event is recorded sequentially together with its associated parameters. These parameters may include quantities such as timestamps, ToF, and ToT, which describe the timing properties of detector signals.
Before the data can be analyzed, the raw event records must be decoded to extract the individual measurement values. Once decoded, these values can be processed or plotted to study their statistical distribution.
Using software tools such as Python, it is possible to automatically read the event buffer, decode the data structure, and generate plots that display the measured quantities.
Requirements
Python environment.
Carrying out the experiment
A Python script connects to the DT1260 and reads the list data buffer containing the recorded event data. The script performs the following operations:
- retrieves the raw event data from the hardware buffer,
- decodes each event to extract timestamp, ToF, and ToT values,
- stores the decoded measurements in arrays for analysis,
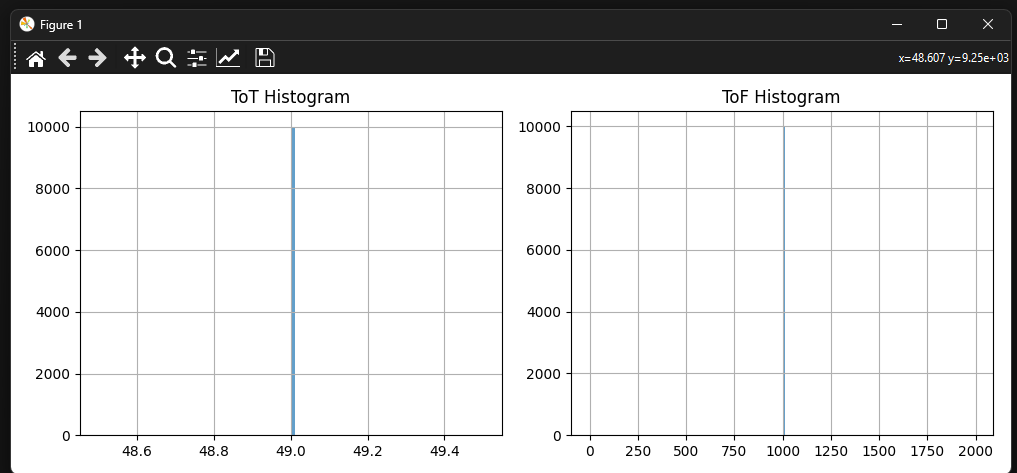
- generates plots to visualize the distributions of ToF and ToT.
This process demonstrates how event data can be processed directly from the acquisition system using a software-based workflow.
Results
The decoded event data are displayed as histograms or scatter plots showing the distributions of ToF and ToT values. By analyzing these plots, students can observe the timing characteristics of the detected signals and verify the measurements performed by the FPGA firmware. This experiment illustrates how software-based data processing and visualization can be used to interpret list-mode acquisition data in digital detector readout systems.