| Difficult | Execution Time | Data Analysis | Radioactive Sources |
|---|---|---|---|
  |
  |
Yes | No |
Purpose of the experiment
The aim of this experiment is to perform a threshold scan to study how the number of detected events varies as a function of the discriminator threshold.
Fundamentals
In detector readout systems, the threshold level of a discriminator determines which signals are accepted as valid events. Signals with amplitudes above the threshold generate a trigger, while smaller signals are rejected as noise. By gradually changing the threshold and measuring the corresponding event rate, it is possible to characterize the signal distribution and understand the relationship between pulse amplitude and detection probability.
This procedure, known as a threshold scan, is commonly used to evaluate detector performance, noise levels, and signal amplitude distributions.
Requirements
Python environment and Matplotlib for plotting.
Carrying out the experiment
A Python program is used to connect to the hardware and read waveform data generated by the FPGA firmware. The program performs the following operations:
- sets a threshold value through the corresponding register,
- resets the event counter,
- waits for a fixed acquisition time,
- reads the number of detected events.
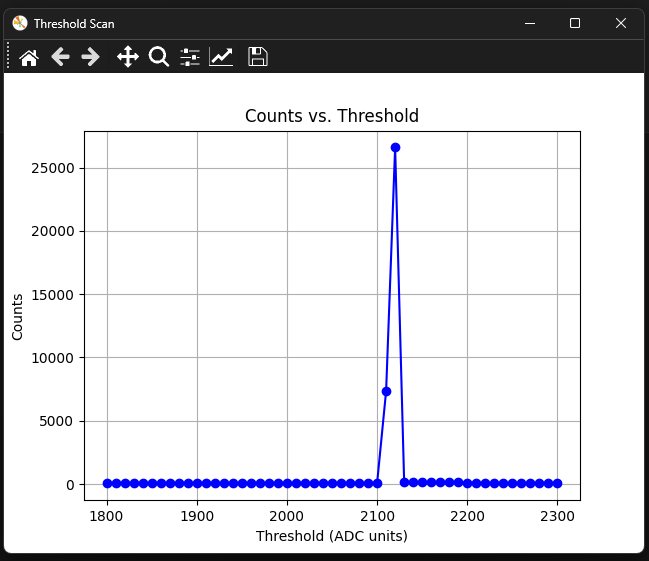
This procedure is repeated for multiple threshold values. The collected data are then stored and plotted to visualize how the event count depends on the threshold.
Results
The measurement produces a curve showing the number of detected events as a function of the threshold value. Students can observe that increasing the threshold reduces the number of detected events, since only larger pulses exceed the discrimination level. This curve provides a simple way to visualize the signal amplitude distribution and evaluate the discriminator setting.